How to Use the Trading Journal: Review Every Trade
Every trade you take in the Trading Simulator, in Replay or Live, lands in your Trading Journal automatically. The journal turns those trades into numbers you can act on: your win
Every trade you take in the Trading Simulator, in Replay or Live, lands in your Trading Journal automatically. The journal turns those trades into numbers you can act on: your win rate, your average R, when you trade best, and which of your setups actually make money.
This guide walks through the journal using two practice sessions on gold (XAUUSD, 15 minutes), 24 trades in total.
Open the Journal
Click Journal in the top menu (you need to be logged in). The sidebar has everything:
- Sessions: every trading session, one row each.
- Trade Log: every trade from every session, in one table.
- Playbook, Tags and Notes: how you label and review trades.
- Position Size Calculator: a quick lot-size tool.
The All accounts menu at the top of the sidebar filters by account (replay sessions, live sessions, imported broker accounts). The time zone menu at the top right sets the time zone for every date and time in the journal.
Step 1. Find a session
The Sessions page lists your sessions with their symbol, start date, number of trades, win rate, P&L and final balance. Use the filters above the table to narrow it down by status, symbol, timeframe, playbook or date range. Click a row to open the session.
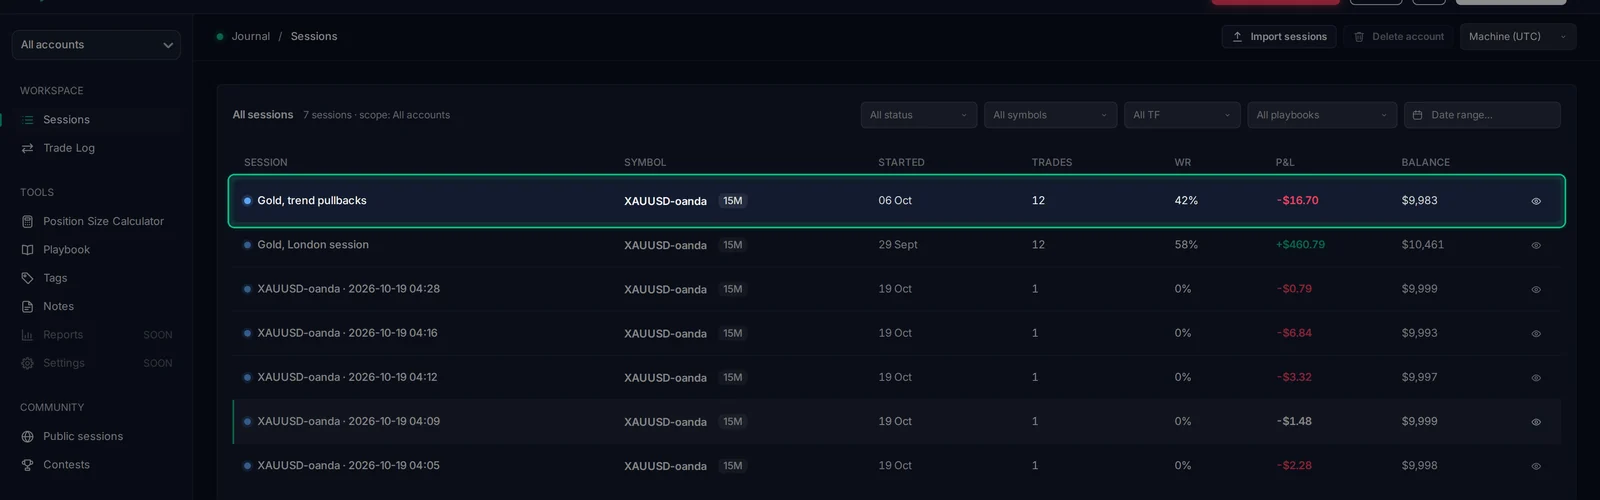
A session is named after its symbol and start time until you rename it. Click the title on the session page to give it a name you will recognise later, for example "Gold, London session".

Step 2. Read the session
A session has four tabs.
Overview
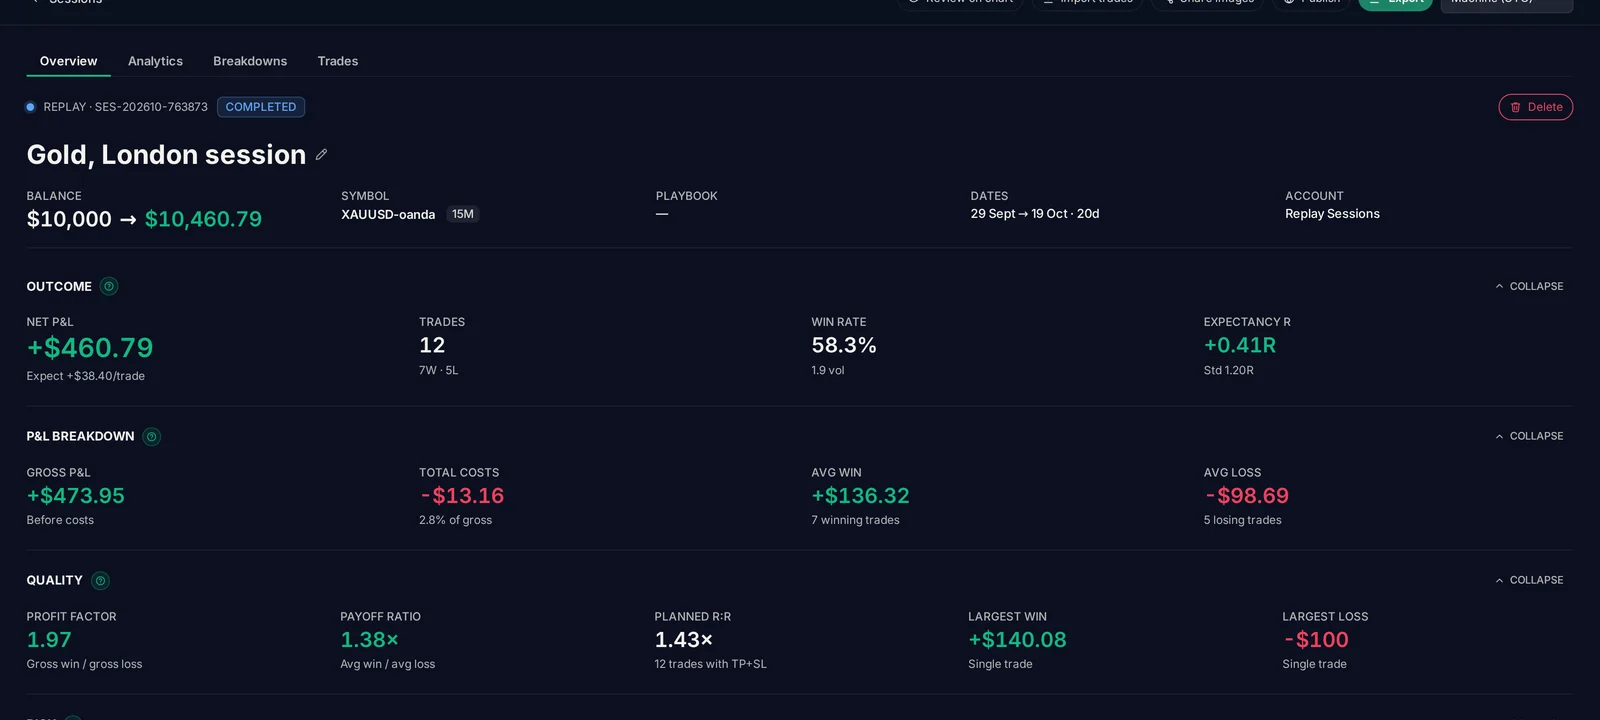
The headline numbers, grouped so you can read them top to bottom:
- Outcome: net P&L, number of trades, win rate and expectancy in R.
- P&L breakdown: gross P&L, total costs (spread, commission, swap), average win and average loss.
- Quality: profit factor, payoff ratio (average win ÷ average loss), planned risk:reward, largest win and largest loss.
- Risk: maximum drawdown, Sharpe ratio, recovery factor and an overall performance score.
- Tempo: average holding time, days traded, best and worst day.
Each group has a ? button that explains its metrics.
Analytics
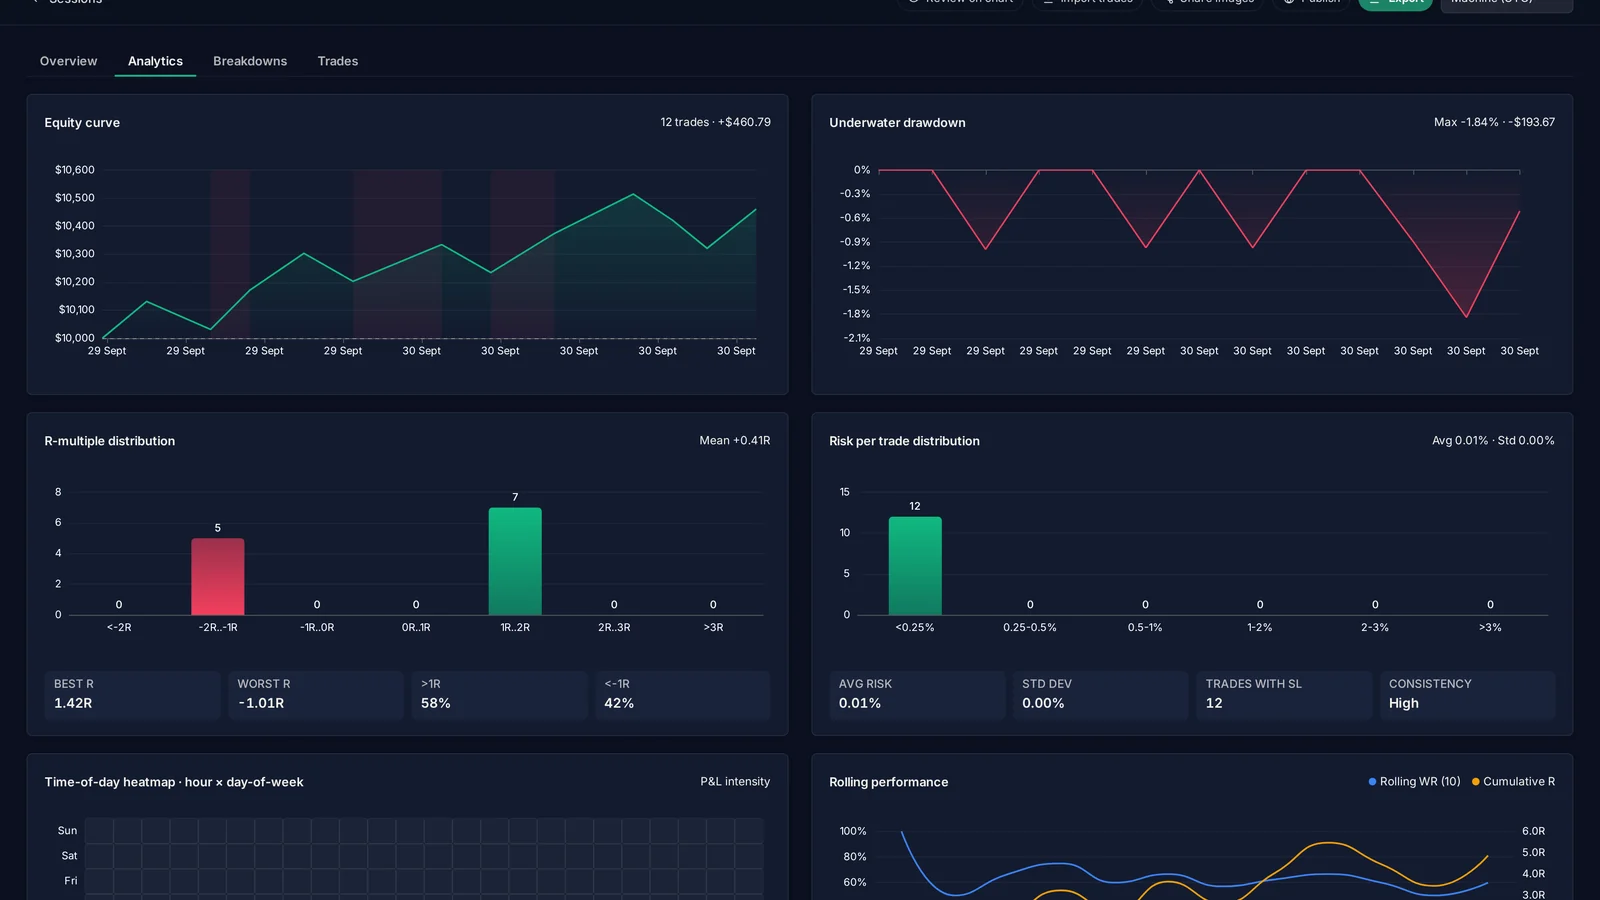
The charts behind the numbers:
- Equity curve and underwater drawdown: how your balance moved and how deep each dip went.
- R-multiple distribution and net per trade: how your results are spread. Here most losers sit at −1R and most winners at +1.4R, which is what a fixed stop and a 1.5R target should produce.
- Time-of-day heatmap: your results by hour and day of the week, to spot the hours you should stop trading.
- Rolling performance: whether you are getting better or worse over the session.
Breakdowns
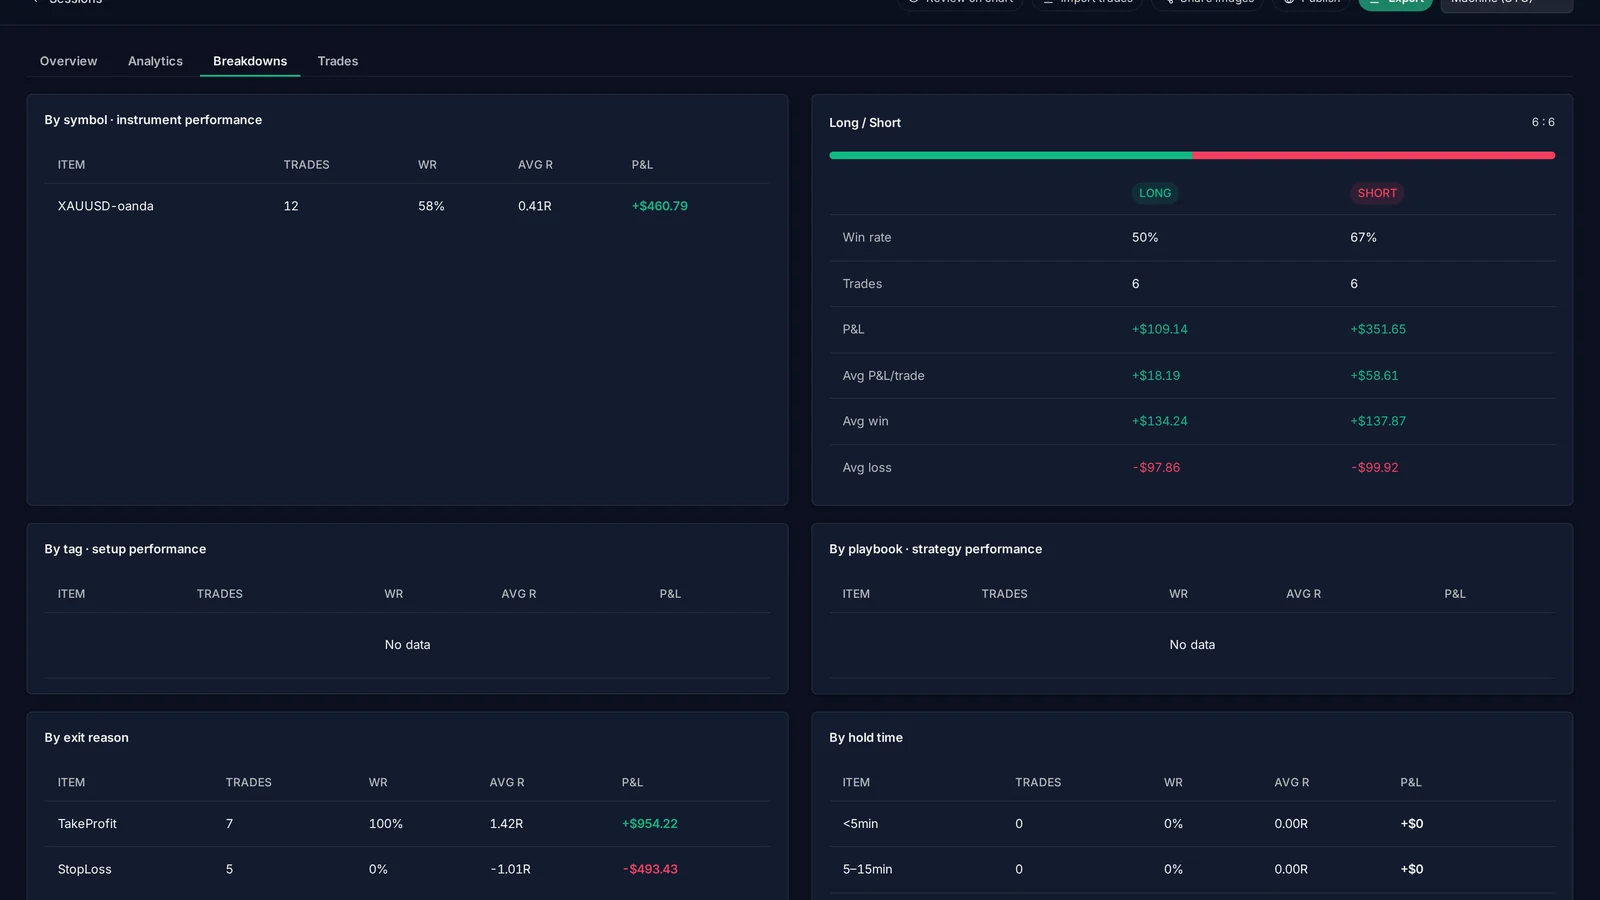
The same trades, sliced: by symbol, long vs short, by tag, by playbook, by exit reason (take profit, stop loss, manual) and by holding time. This is where you find out, for example, that your shorts make money and your longs don't.
Trades
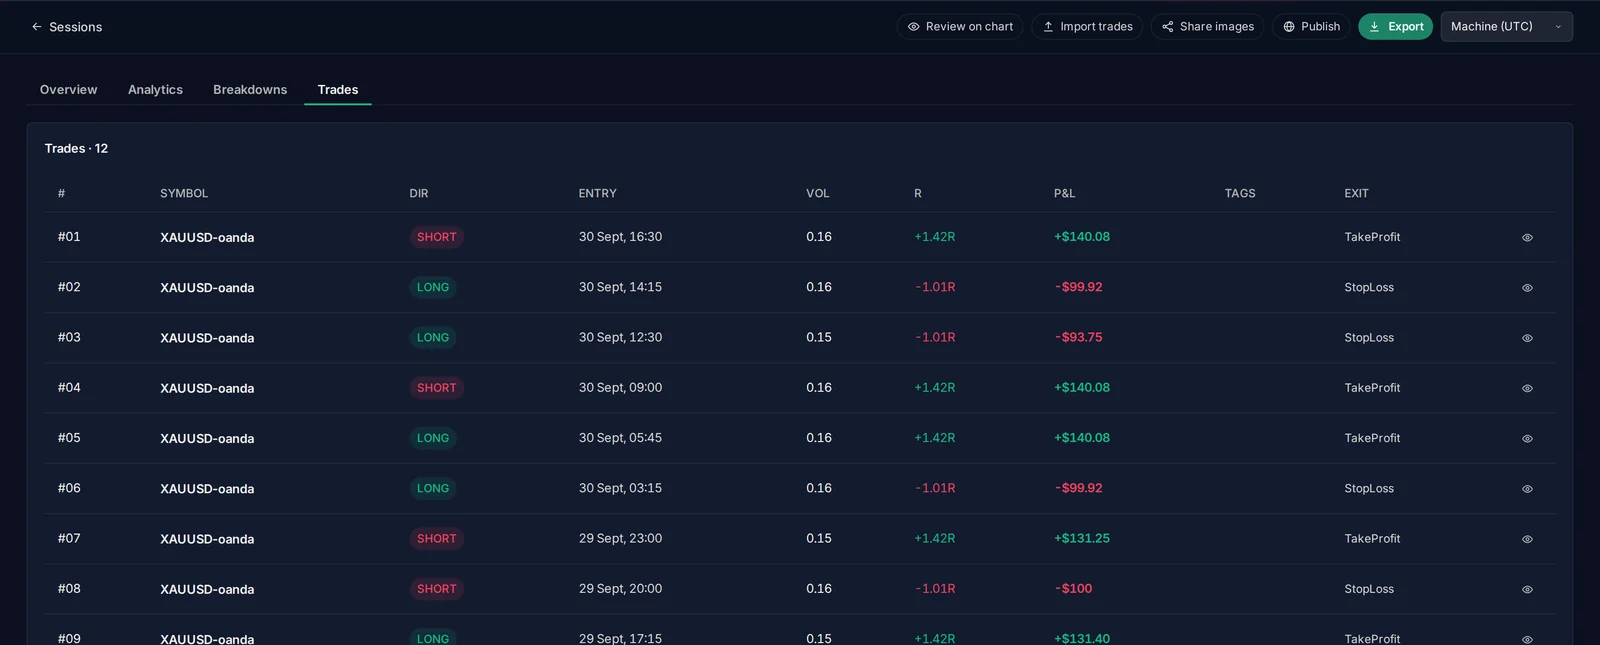
Every trade of the session with its direction, entry time, volume, R, P&L, tags and exit reason. Click a trade to open its details.
Session actions
The buttons at the top of a session:
- Review on chart opens the chart and replays the session, with your entries and exits drawn on it.
- Import trades adds trades to this session from a broker statement or a template.
- Share images downloads the stat tabs as images (a ZIP), ready to post.
- Publish creates a public link and lists the session in Public sessions, where other traders can see it. You choose whether money amounts and notes are shown.
- Export downloads the session to Excel.

Step 3. Look at every trade
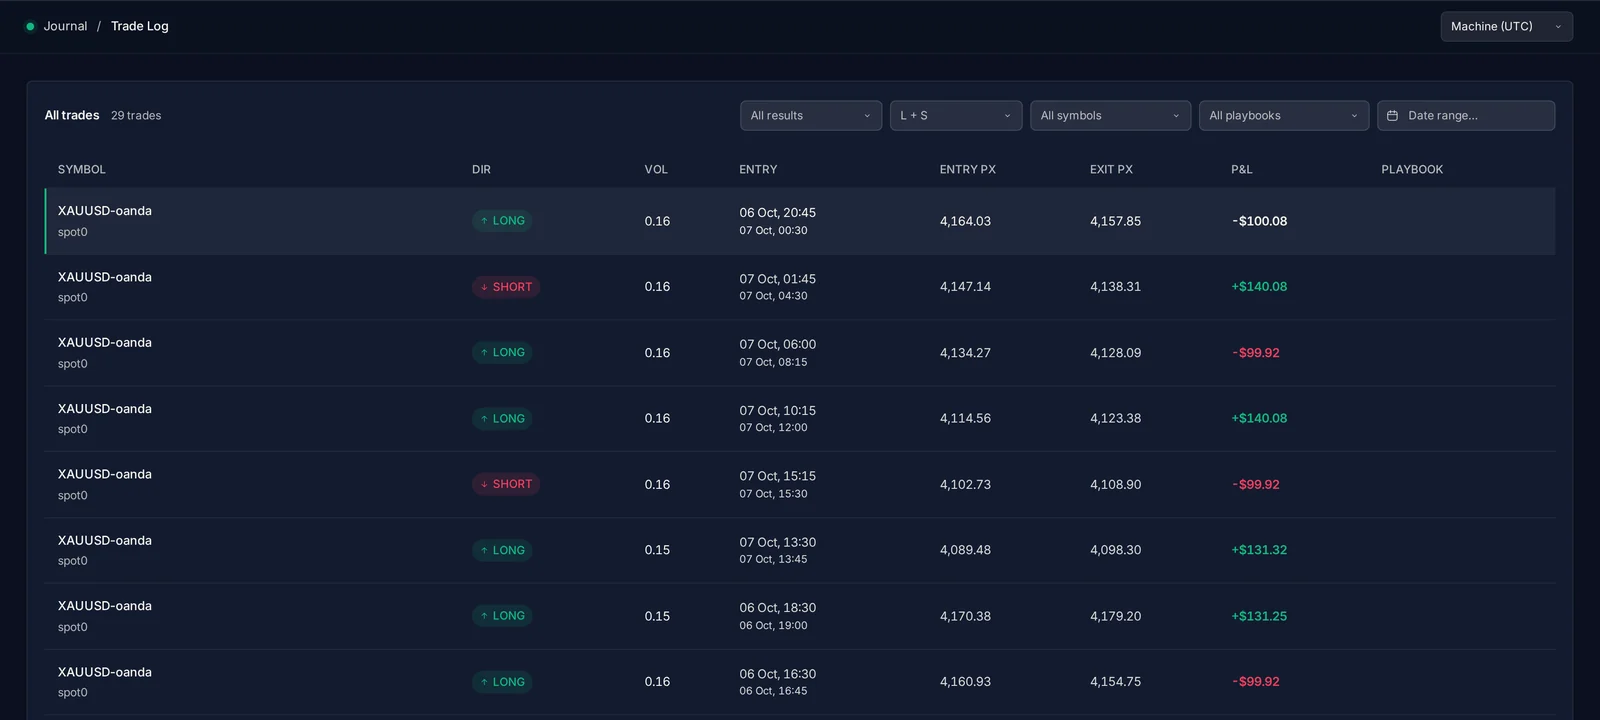
Trade Log lists every trade across all your sessions, with filters for result (win or loss), side, symbol, playbook and date. Click any row to open the trade.
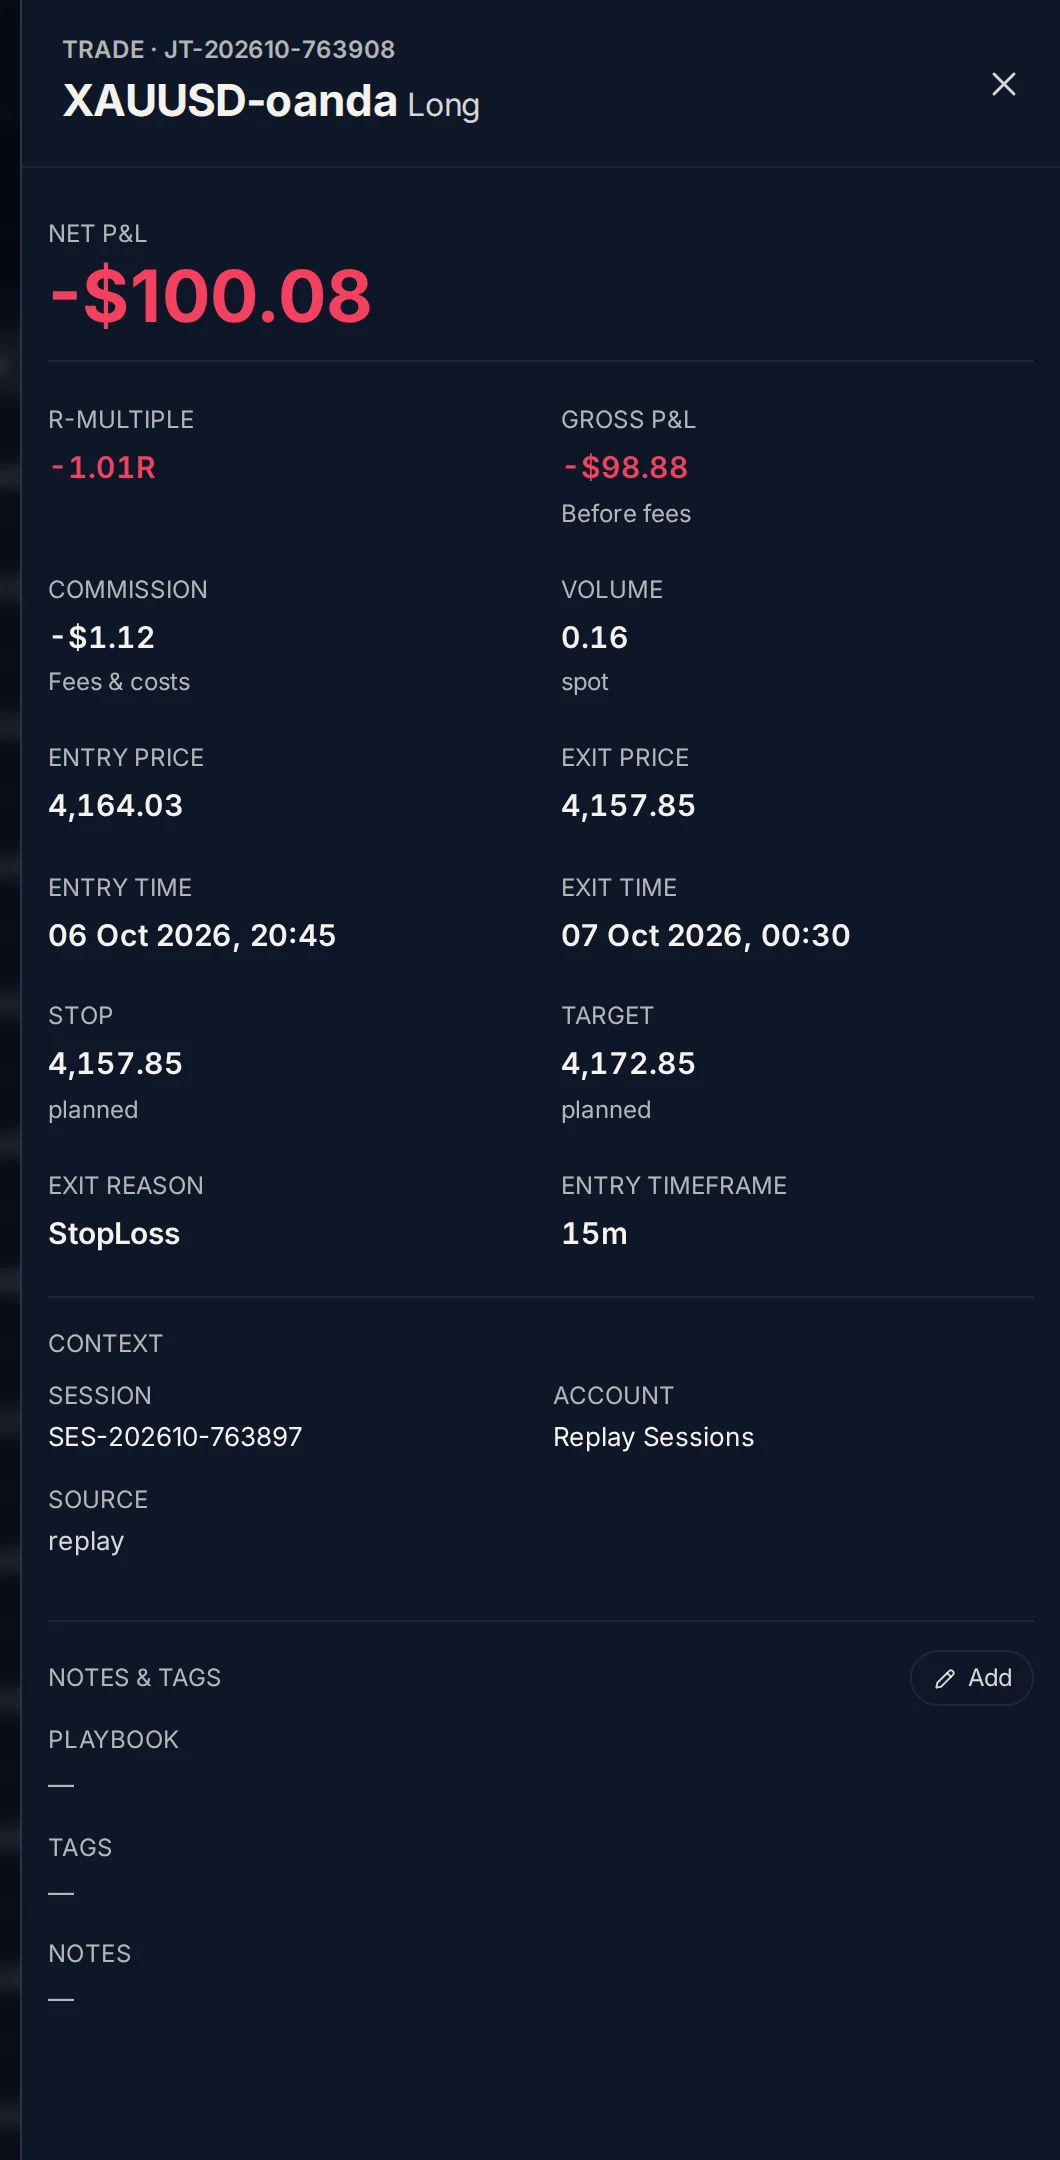
The trade panel shows everything about one trade: net and gross P&L, R-multiple, commission, volume, entry and exit price and time, the planned stop and target, why it closed, and which session and account it belongs to. The Review on chart button opens the chart and replays that trade.
Step 4. Label your trades
Numbers tell you what happened. Labels tell you why. The journal has three kinds.
Playbooks: your strategies
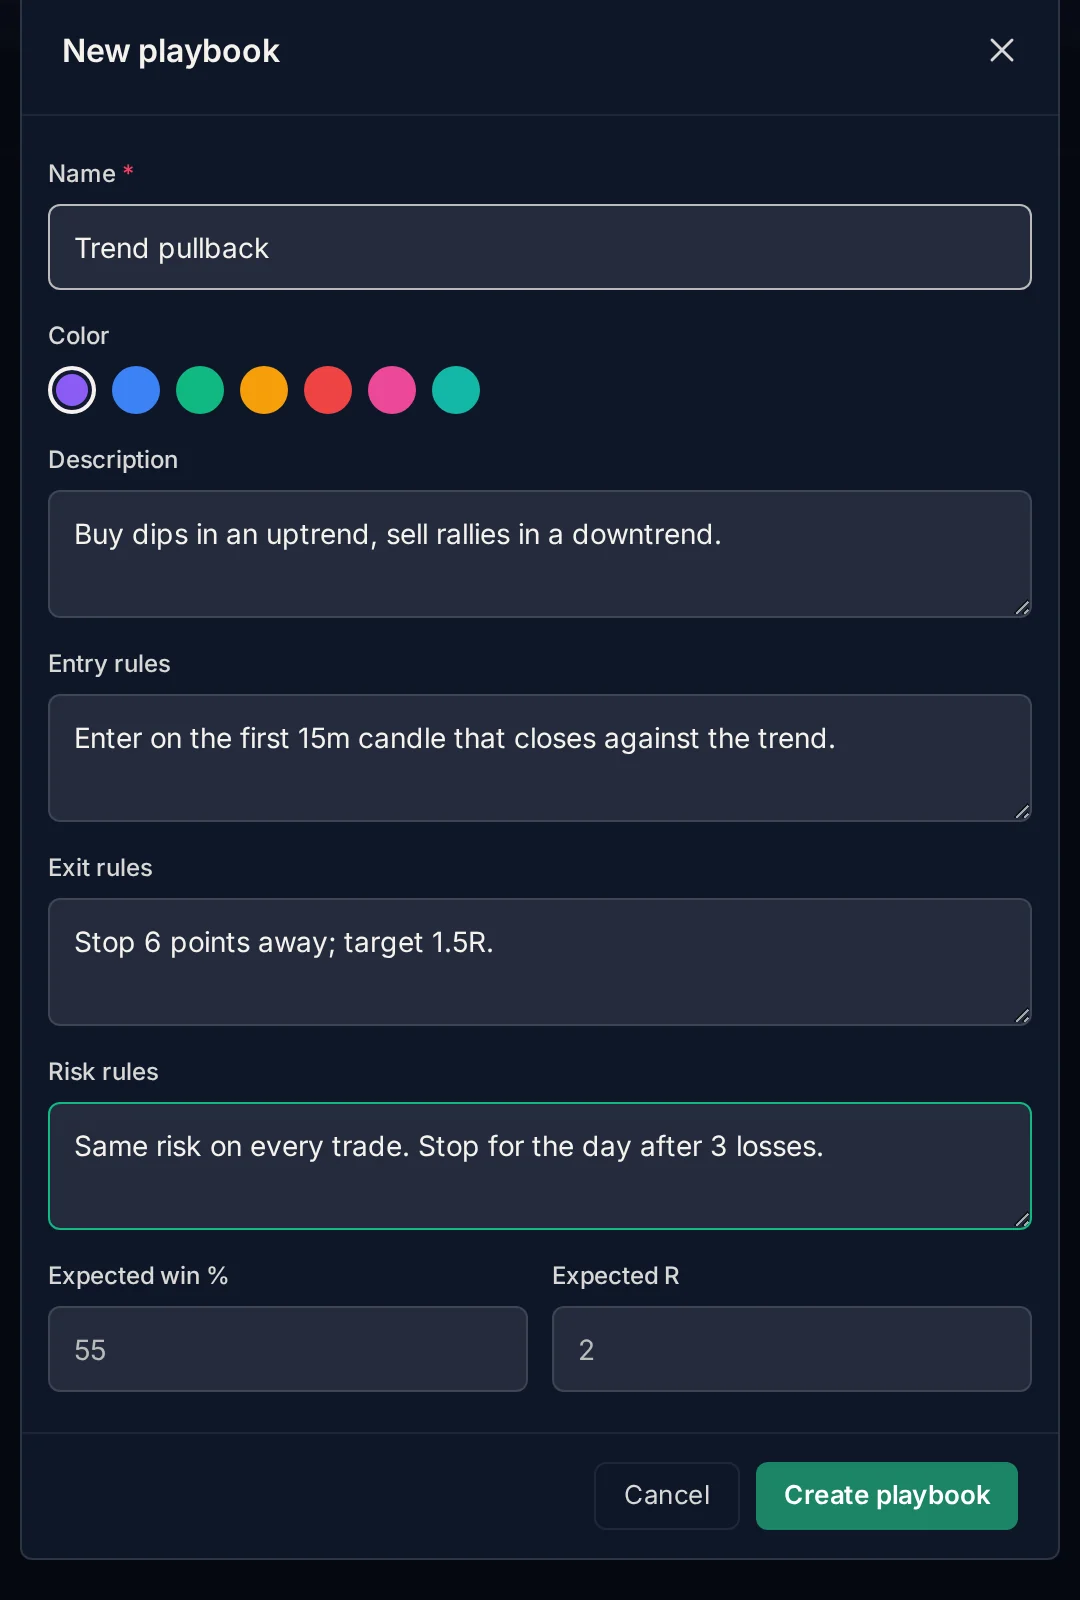
A playbook is one strategy you trade. Go to Playbook and click New. Give it a name and a color, then write down the rules: description, entry rules, exit rules, risk rules, and the win rate and R you expect from it.
Tags: anything else worth tracking
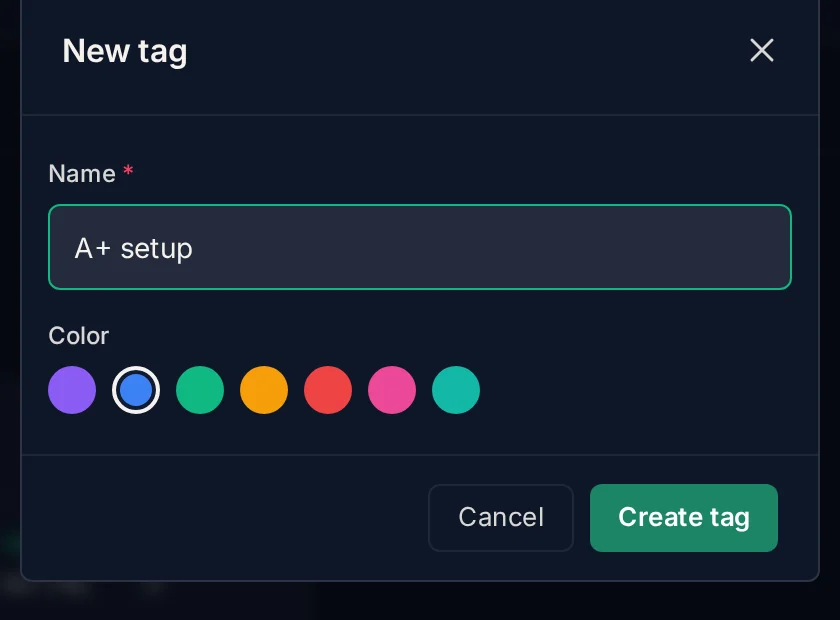
Tags are free labels: the quality of a setup, a mistake, the market condition. Go to Tags, click New, and give the tag a name and a color. In this example: "A+ setup" for trades that followed the plan, and "Late entry" for the ones that didn't.
Apply them to a trade
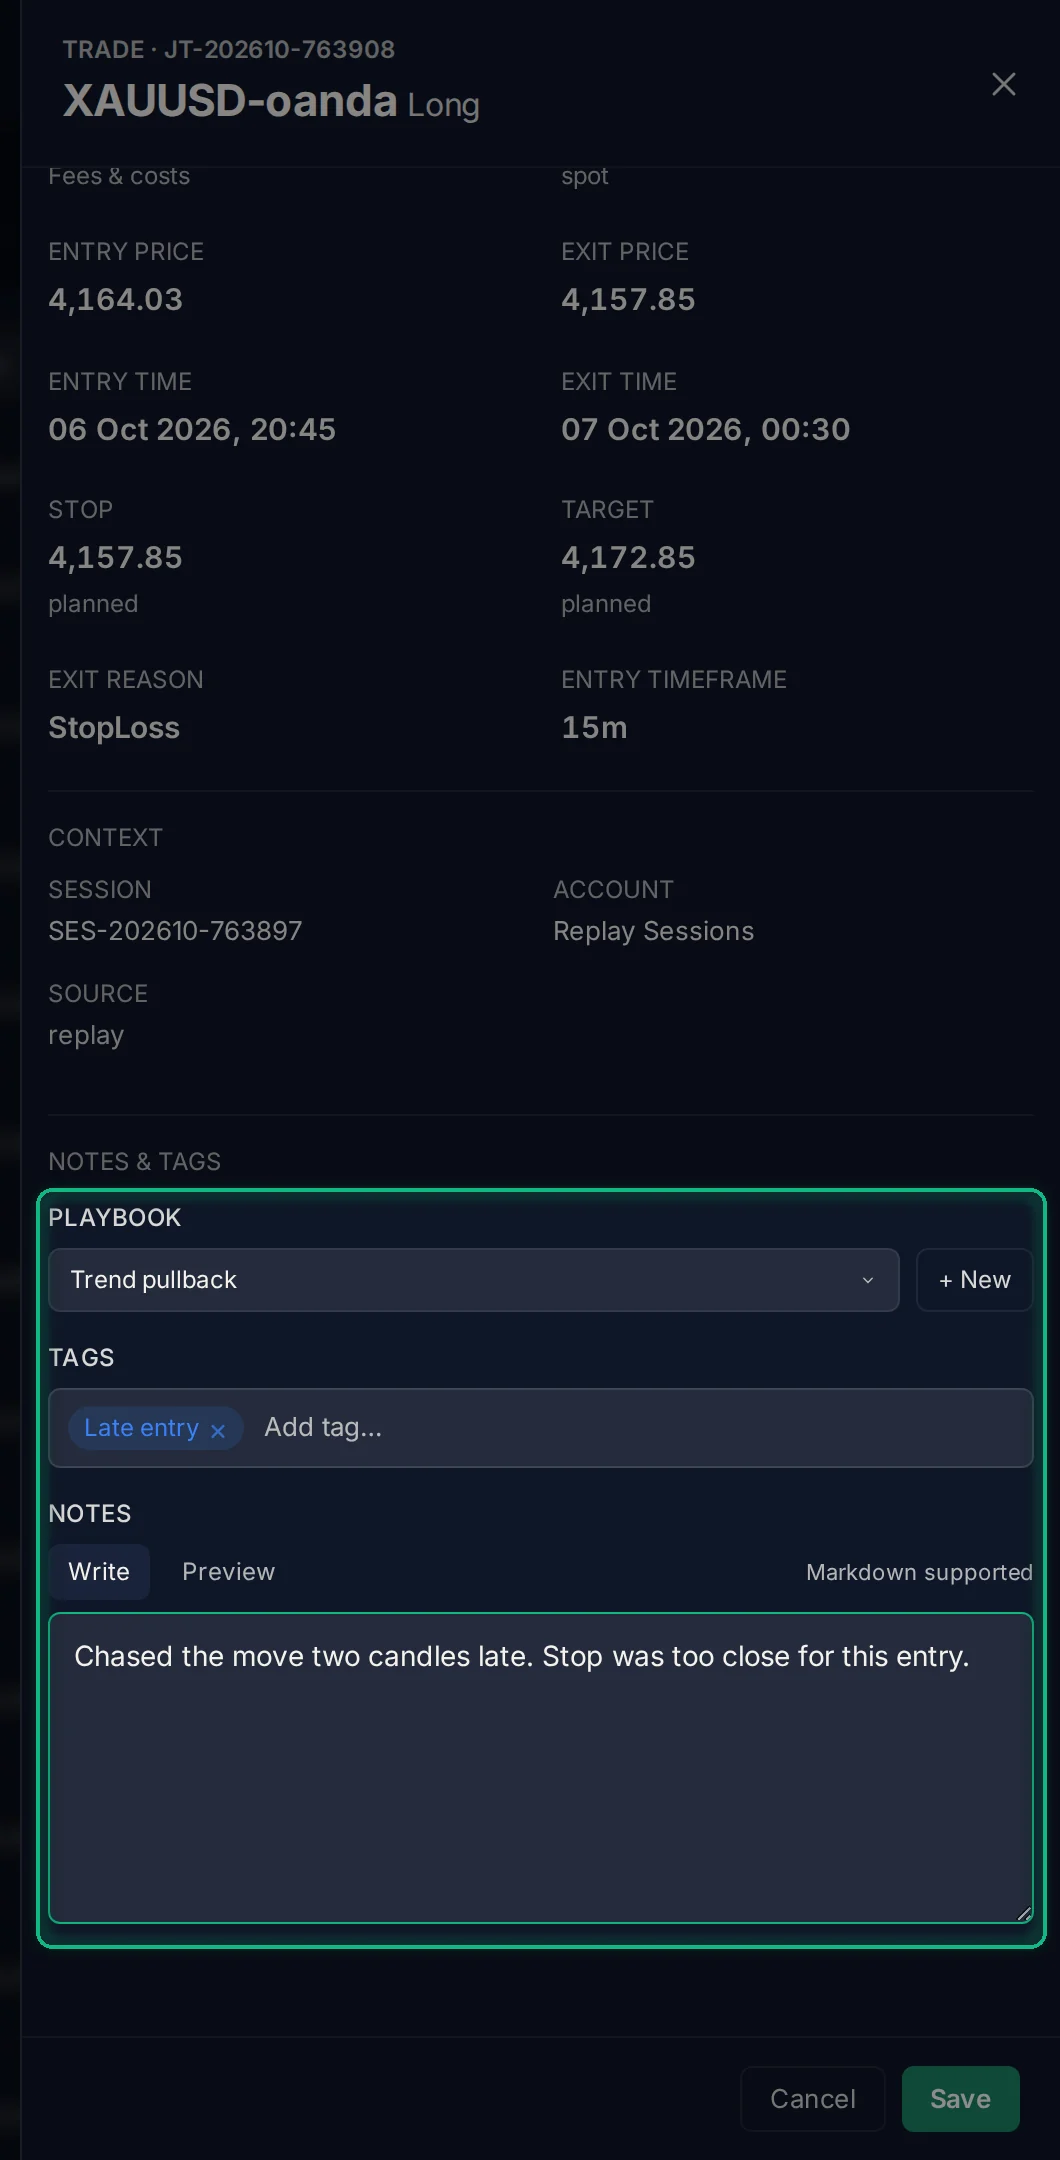
Open a trade and click Add next to Notes & tags:
- Playbook: pick the strategy (or create one on the spot with + New).
- Tags: type to pick a tag, or type a new name to create it.
- Notes: write what you were thinking. Markdown is supported, and Preview shows how it will look.
Click Save.
Tip: you can also label a trade while you trade. In the Trading Simulator's order panel, click + Setup before placing the order to pick a playbook, tags and a note.
Step 5. Learn from your labels
Once trades carry labels, the journal adds them up.
Playbook shows each strategy with its number of trades, win rate, net P&L and average R:
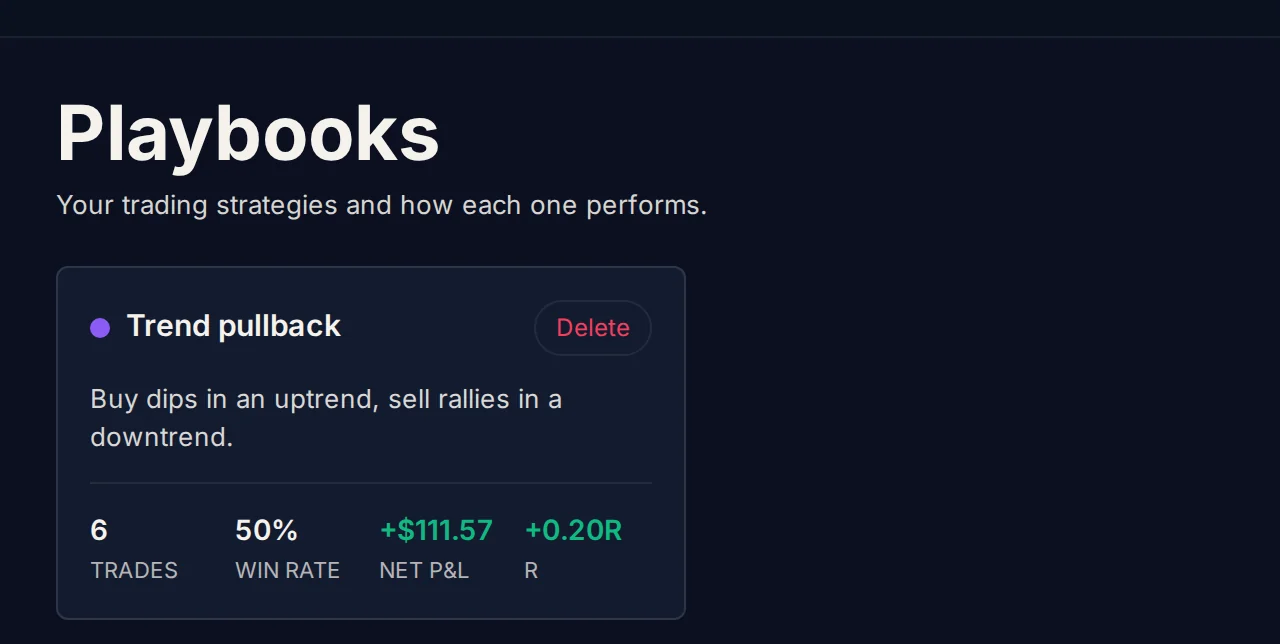
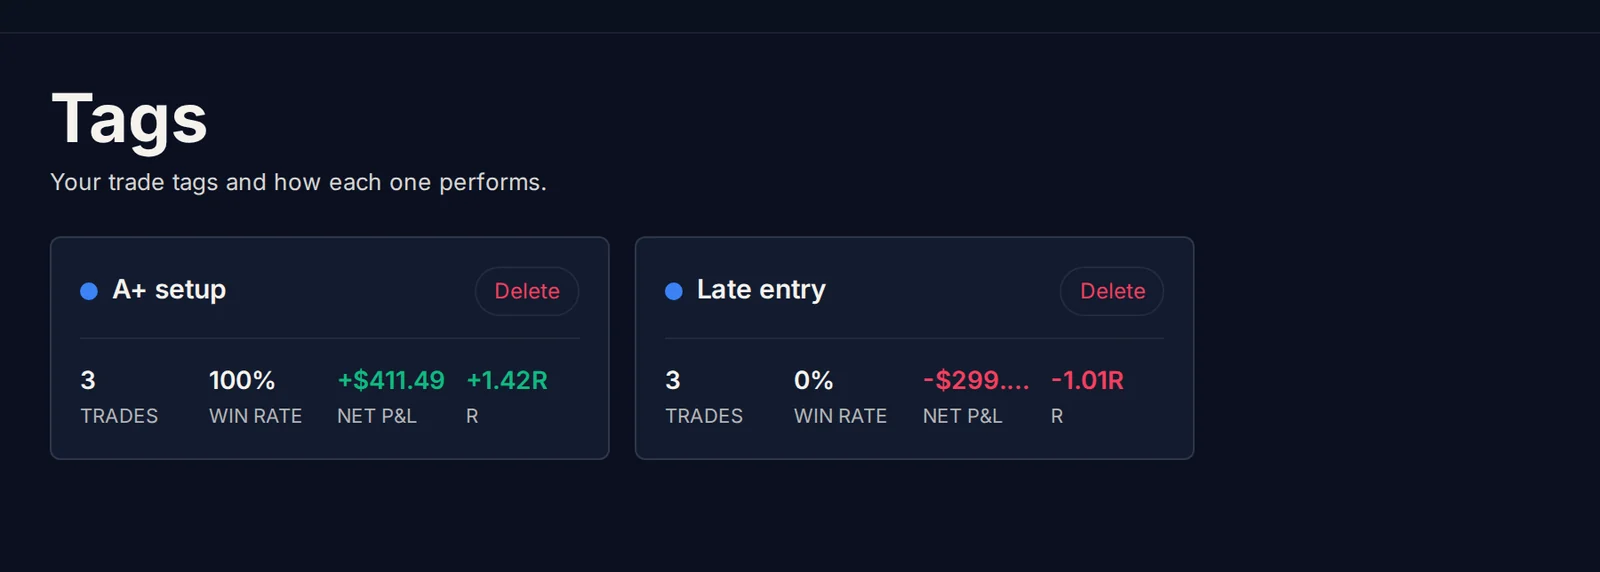
Tags does the same per tag. Here, the three trades tagged "A+ setup" all won (+$411), and the three "Late entry" trades all lost (−$299). The playbook as a whole made only +$112. Cut the late entries, and it would have made almost four times as much.
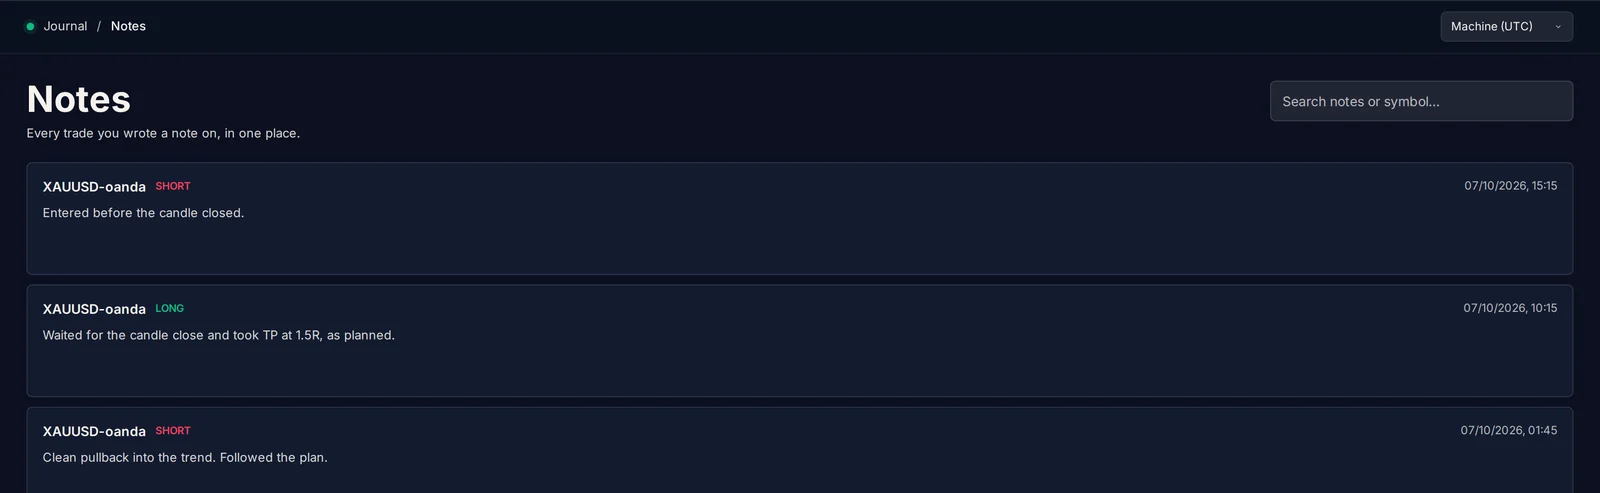
Notes collects every note you wrote, newest first, with a search box. Read it once a week: the same mistakes show up quickly.
Bonus: import your real trades
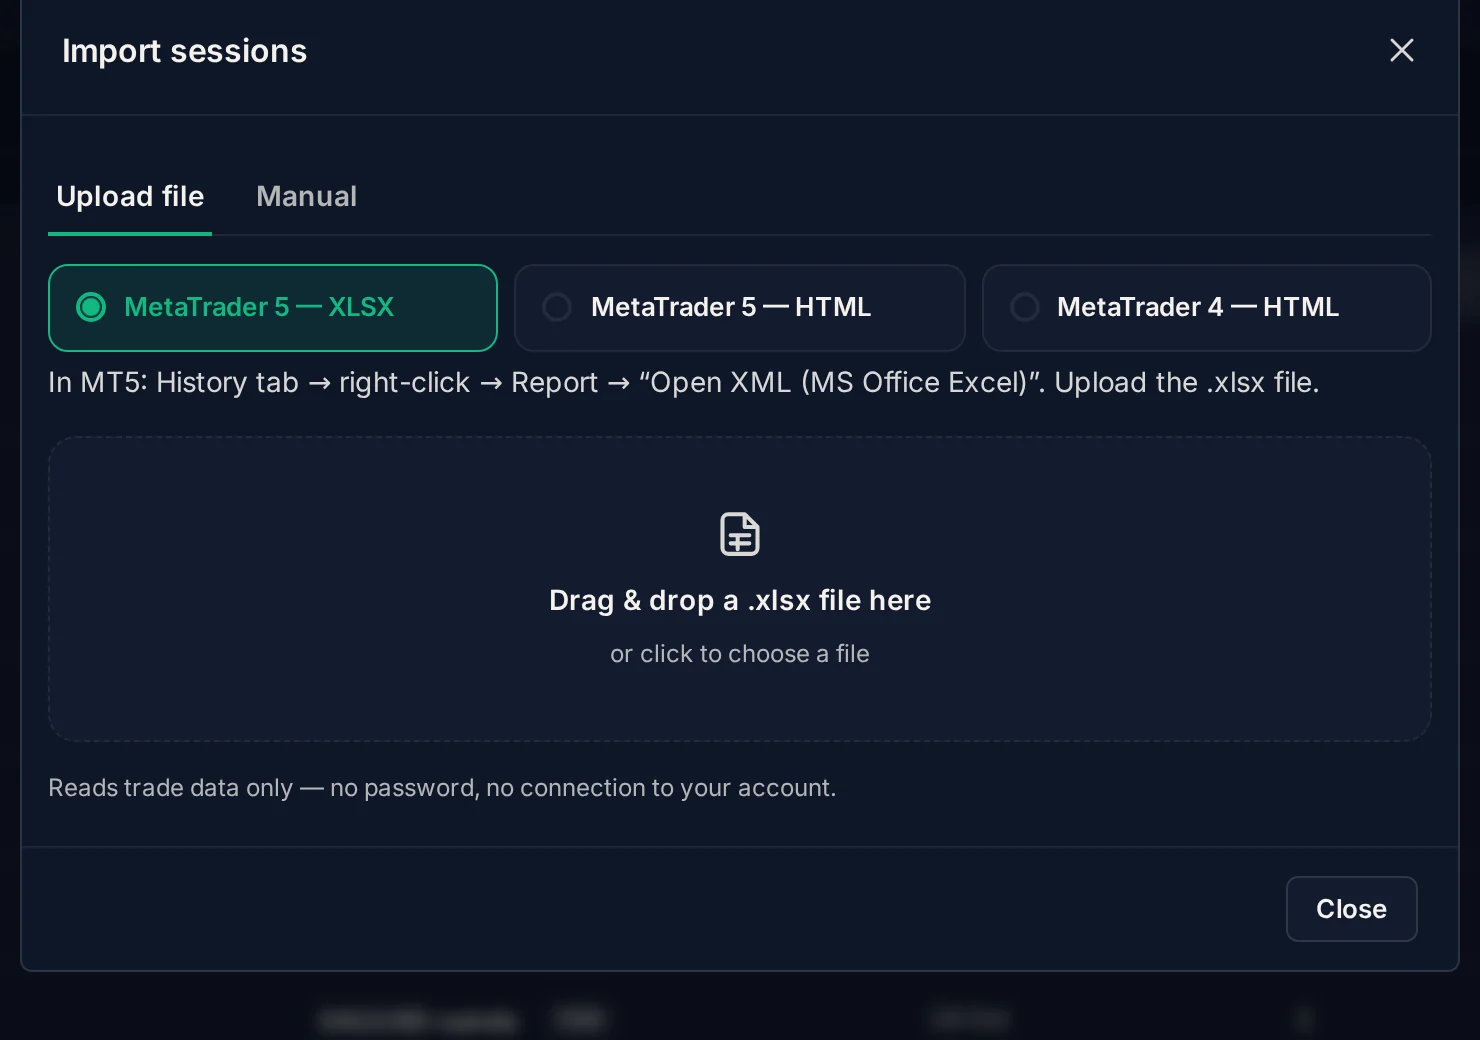
The journal is not only for simulator trades. On the Sessions page, click Import sessions to bring in your trading history from MetaTrader 5 (XLSX or HTML report) or MetaTrader 4 (HTML statement). The importer reads the file only. It never asks for your password and never connects to your broker account. The Manual tab takes The Free Chart's own XLSX template, which you can download from the same dialog and fill in with trades from any broker.
A simple weekly routine
- After each session, open it and read the Overview. One sentence in a note: what went well, what didn't.
- Label every trade with a playbook and at least one tag.
- Once a week, open Breakdowns, Playbook and Tags. Find the setup or habit that costs you the most, and write one rule to stop it.
- Practice that rule in Replay before using it with real money.
The Trading Journal is free. Open a chart, trade a session in the simulator, and your first journal entry is already waiting for you.
No comments yet. Login to start a new discussion Start a new discussion