How to Build Your Own Indicator: Write, Test and Publish
The built-in indicators and the Marketplace cover a lot, but sometimes you want an indicator that works exactly your way. On The Free Chart you can write your own in JavaScript, right next to your
The built-in indicators and the Marketplace cover a lot, but sometimes you want an indicator that works exactly your way. On The Free Chart you can write your own in JavaScript, right next to your chart. Test it on live prices, then keep it for yourself, share it with a few people, or publish it to the Marketplace, for free or for a price.
This guide walks through the whole loop with a simple example: a moving average you can tune from the chart.
You need a free account. Writing and testing indicators doesn't cost anything.
Step 1. Open Build Indicators
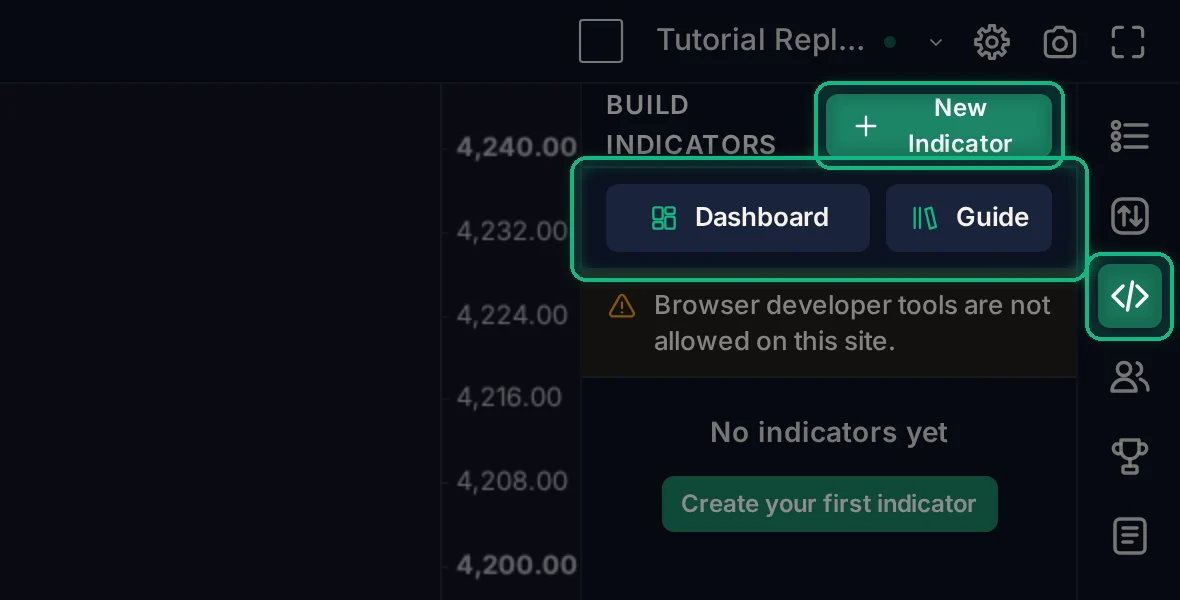
Click the Build Indicators icon (</>) in the right-hand toolbar. The panel shows the indicators you have built, with two buttons at the top: Dashboard opens the Developer Dashboard, where you decide who can use them, and Guide opens this article.
Click New Indicator.
Step 2. Meet the editor
The editor opens beside your chart, so you see your code and its result at the same time.
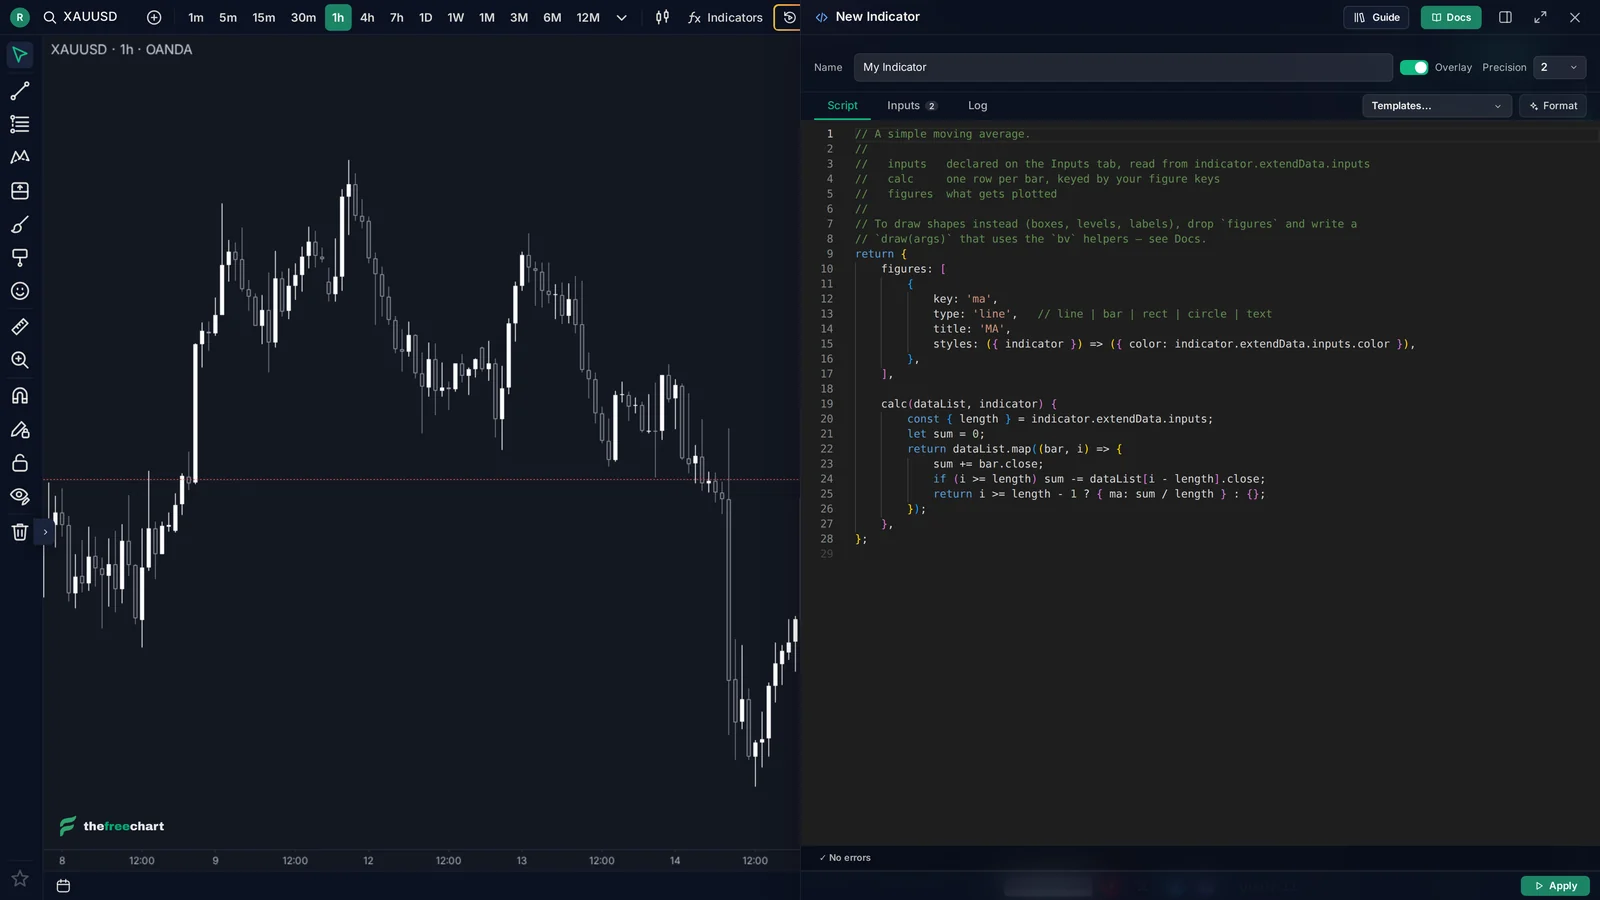
At the top:
- Name: what your indicator is called in the legend and in your list.
- Overlay: on, the indicator is drawn over the price (like a moving average). Off, it gets its own pane below the chart (like RSI).
- Precision: how many decimals its values show.

The icons at the top right dock the editor into the sidebar, make it wider, or close it. Guide opens this article, and Docs opens the developer documentation, the most important page when you write an indicator (next step).
Step 3. Read the Docs (the developer guide)
The Docs are the reference for everything an indicator can do, and the page to keep open while you write one. Click Docs in the editor, or open the Custom Indicators Developer Guide directly.
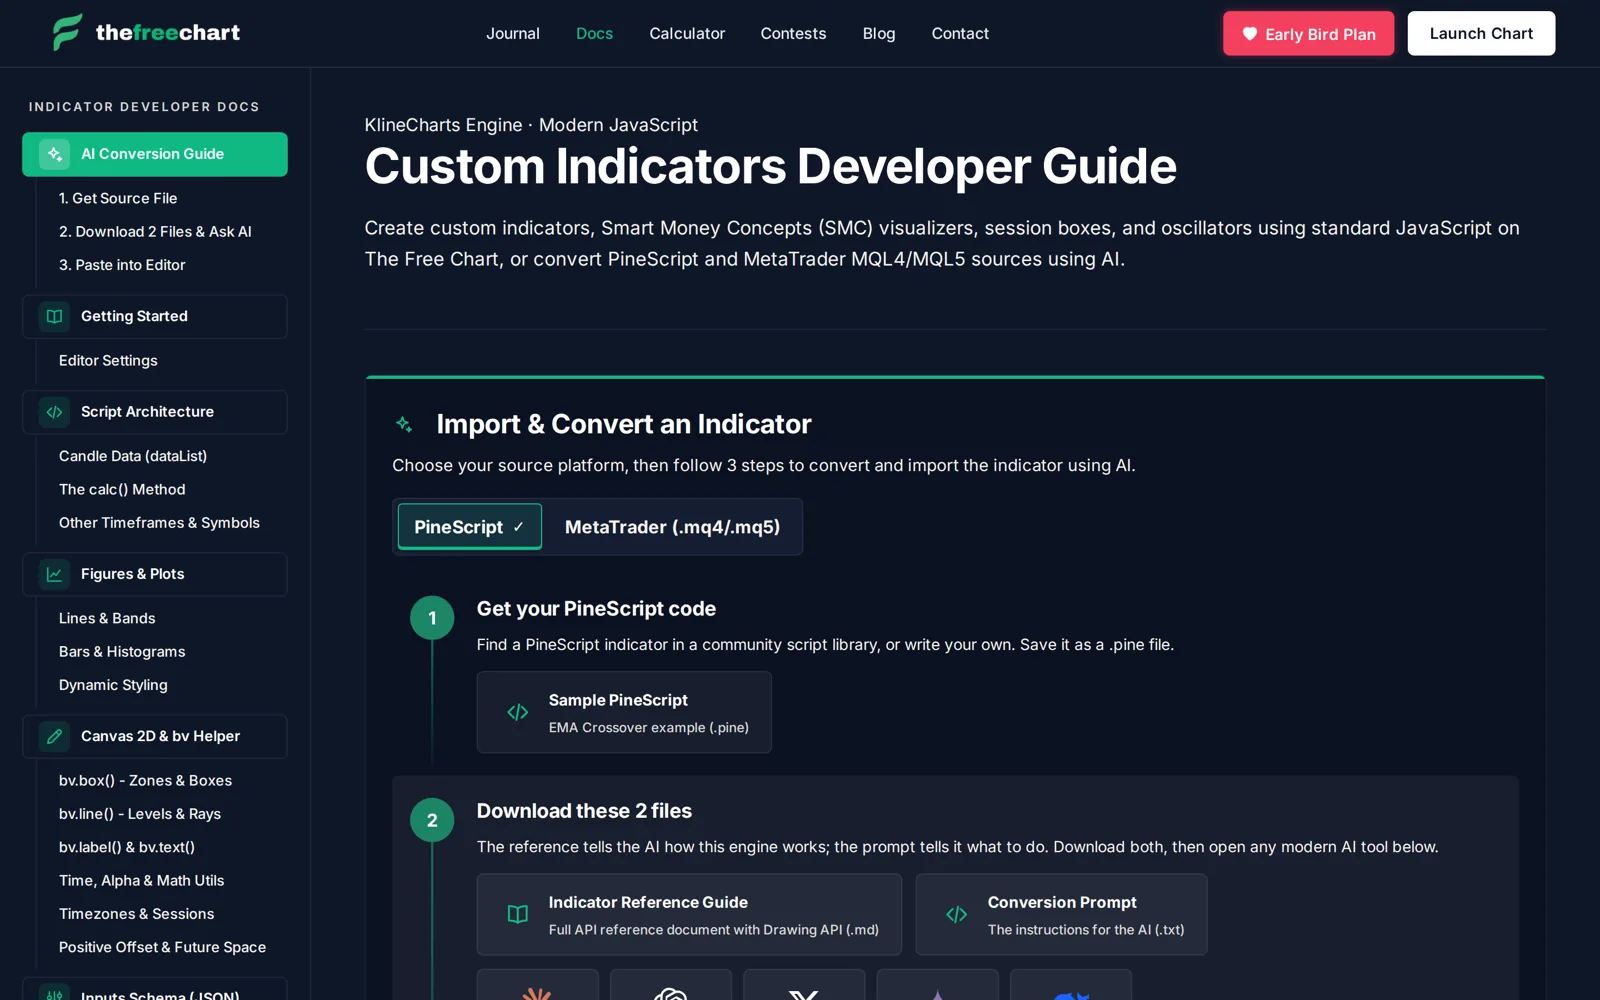
What's inside, from the menu on the left:
- Getting Started and Script Architecture: what
calc,figuresanddraware for, the candle data your script receives (dataList), and how to read other timeframes and symbols. - Figures & Plots: lines, bands, bars, histograms, and colours that change bar by bar.
- Canvas 2D & bv Helper: drawing boxes, levels, labels and text with
bv.box(),bv.line()andbv.label(), plus time zones, sessions and drawing into the future space on the right. - Inputs Schema (JSON): every input type, the Inputs tab vs the Style tab, and how to read inputs in your script.
- Performance: Avoid Chart Lag: when your code runs, the rules that keep
calcanddrawfast, and a checklist before publishing. - 4 Gold Standard Archetypes: complete examples you can copy: a multi-line overlay (Bollinger Bands), a sub-pane histogram (Squeeze), sessions and killzones, and SMC order blocks.
- Troubleshooting & Tips: the mistakes people make most, and how to avoid them.
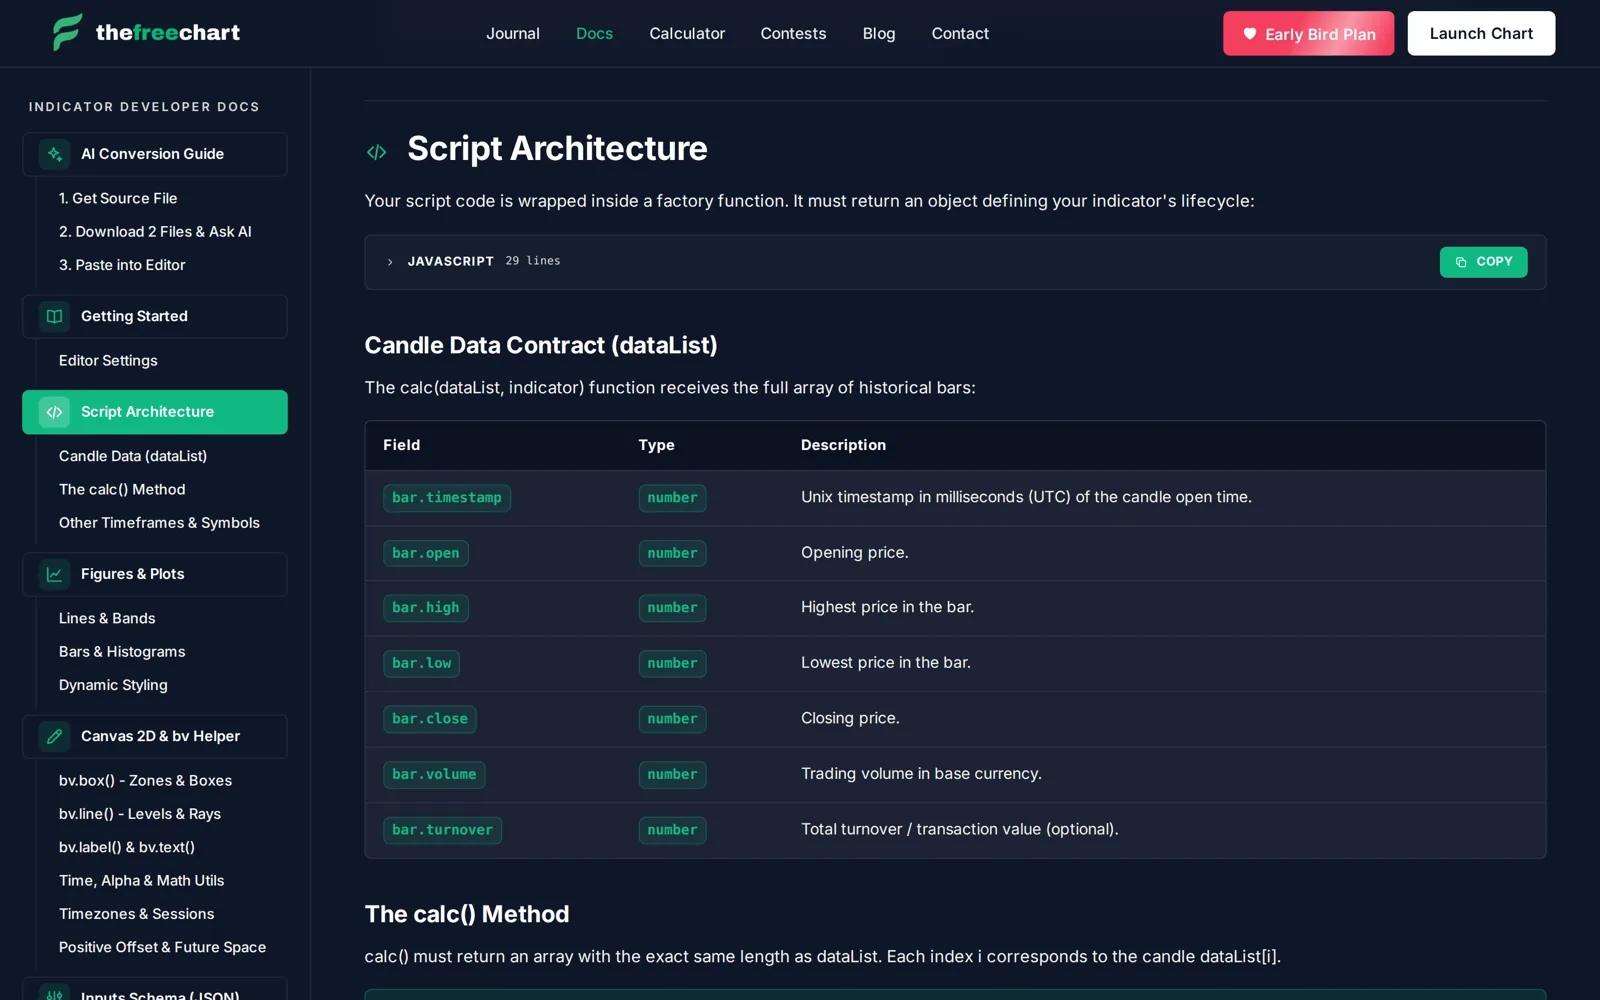
Every section has code with a Copy button, and tables that list each field:
Convert an indicator with AI
Already have an indicator in PineScript or MetaTrader (.mq4 / .mq5)? The Docs open with an AI Conversion Guide:
- Get the source file. For MetaTrader you need the
.mq4or.mq5source; compiled.ex4/.ex5files can't be converted. - Download the 2 files from the Docs, the Indicator Reference Guide and the Conversion Prompt. Attach them with your source to an AI tool such as Claude, ChatGPT, Grok, Gemini or DeepSeek, and say: "convert this."
- The AI returns 2 code blocks. Paste one into the Inputs tab and one into the Script tab, then click Apply.
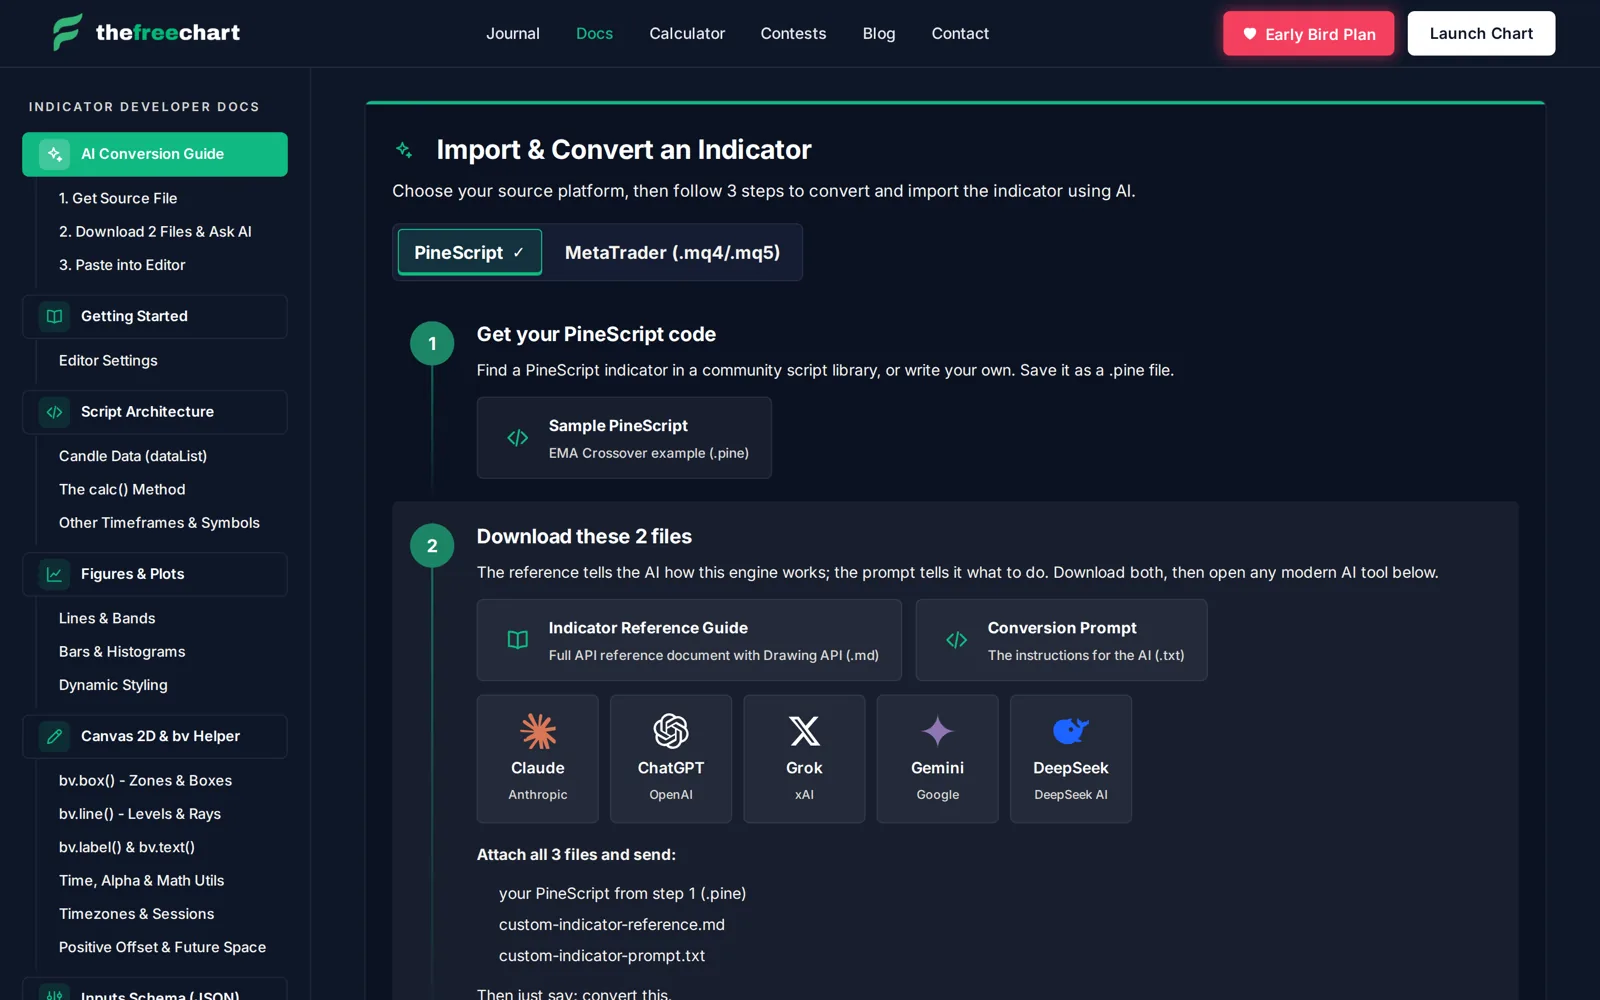
Treat what the AI writes like any other code: apply it, check the Log tab for errors, and compare it with the original on the same chart before you rely on it.
Step 4. Start from a template
A new indicator is never blank: it starts as a working simple moving average. To start from something else, open Templates... and pick one: EMA ribbon, RSI with bands, Bollinger Bands, ICT session killzones, fair value gaps and more.
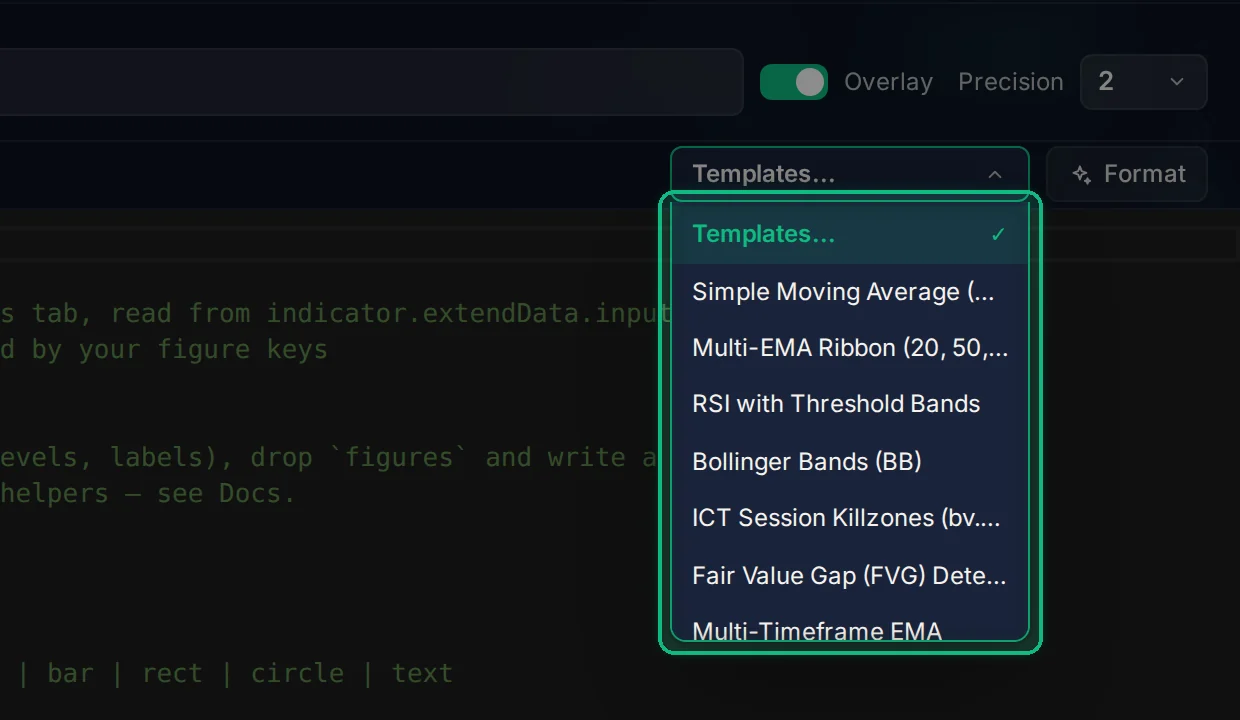
Templates are real, complete indicators. Reading one is the fastest way to learn how a particular kind of indicator is built.
Step 5. Read the script
The Script tab holds the code. An indicator returns an object with two parts:
- figures: what gets drawn. Each figure has a
key, atype(line,bar,rect,circleortext), a title, and a style. - calc: runs over the bars and returns one row per bar, keyed by your figure keys. Here, each row holds
ma, the average of the lastlengthcloses.
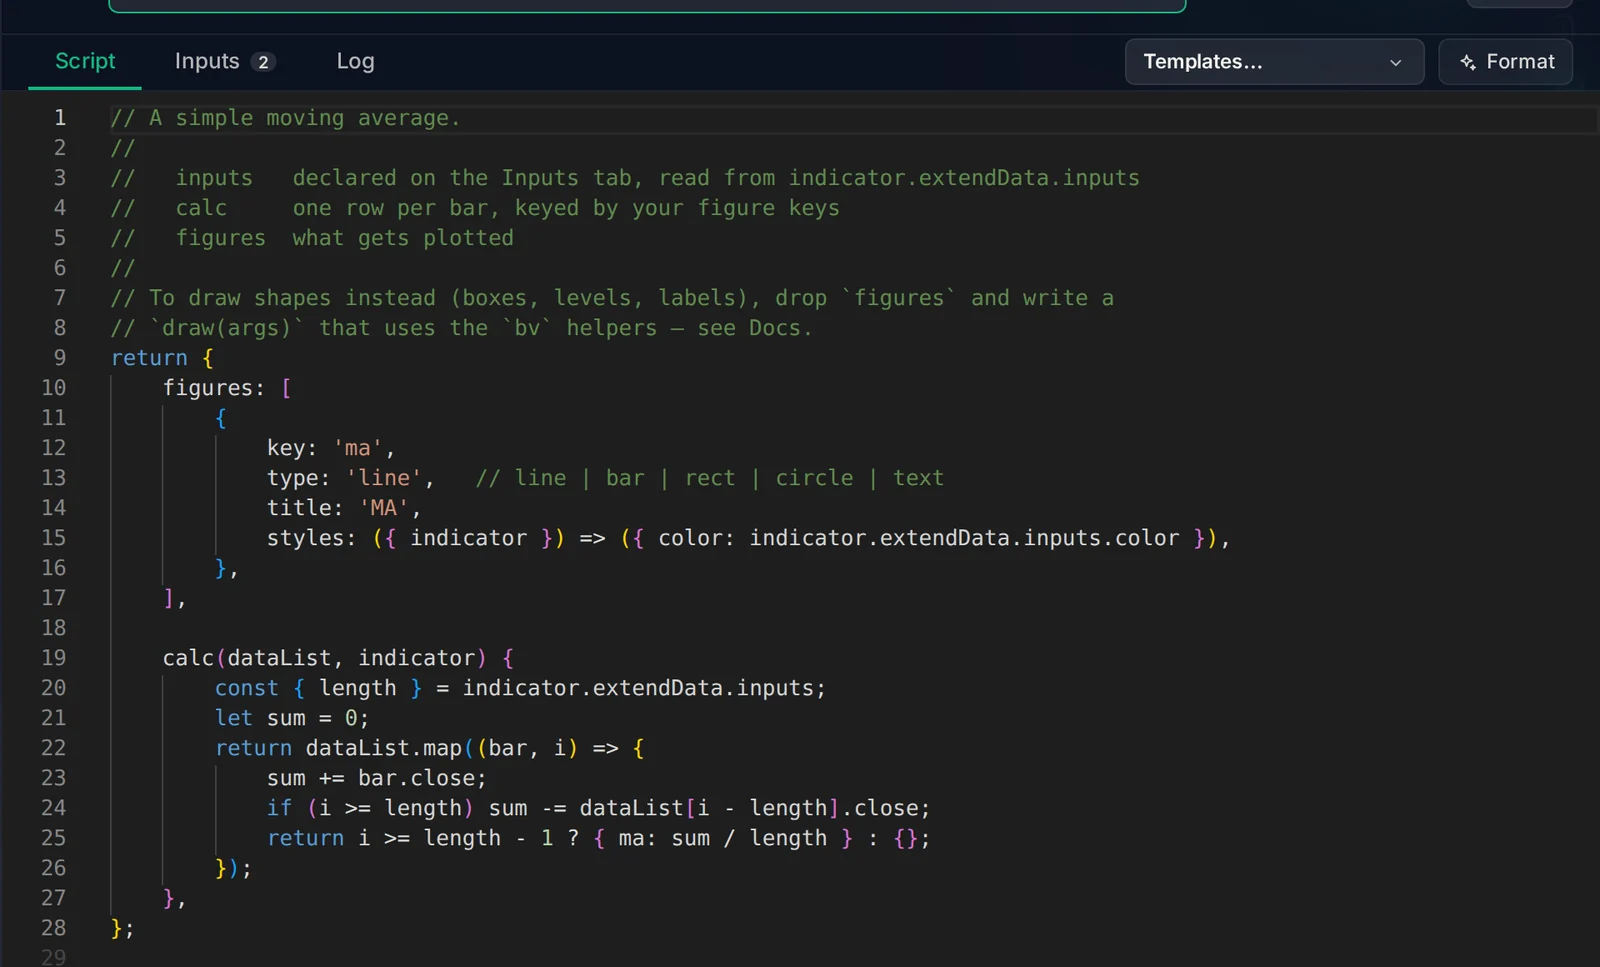
To draw shapes instead of lines (boxes, levels, labels), you write a draw function with the bv helpers. The Docs cover it.
Step 6. Declare inputs
The Inputs tab lists the settings people can change without touching your code. Each input has an id (how the script reads it, from indicator.extendData.inputs), a name shown in the settings window, a type and a default value (defval). Numbers can have a min and max.
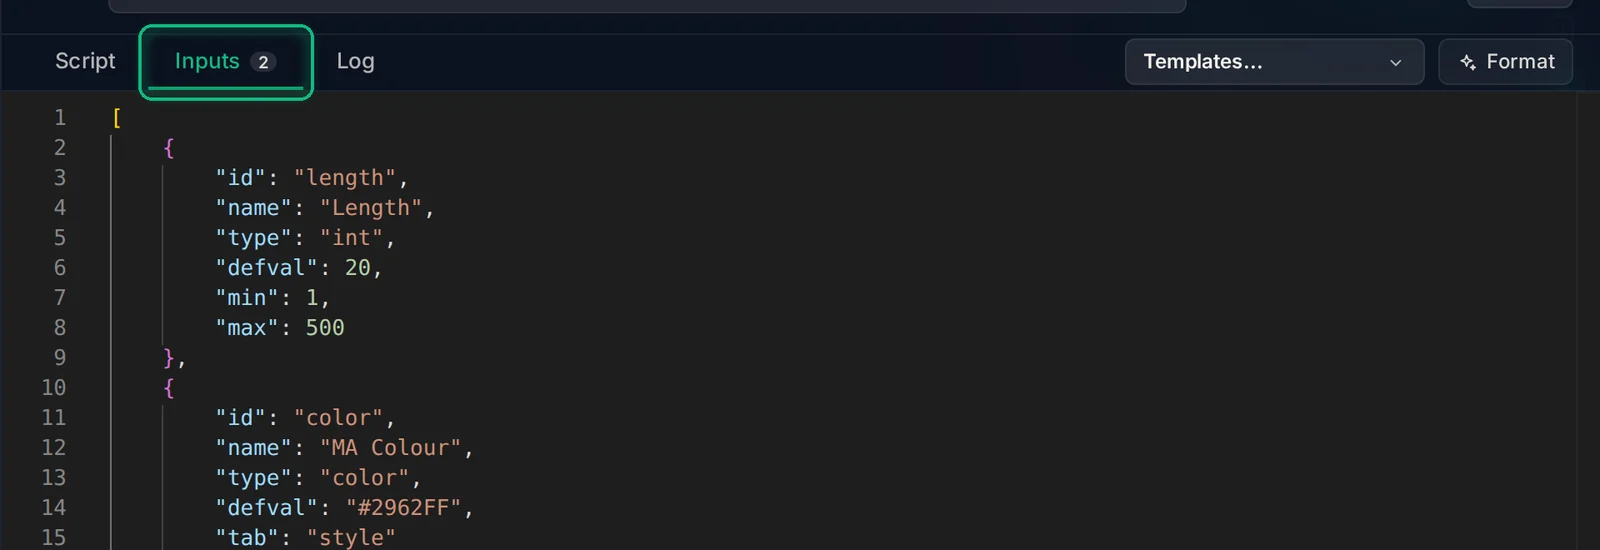
Supported types: int, float, bool, color, select, text, time, session, symbol and timeframe. Add "tab": "style" to show an input on the Style tab instead of Inputs, as the colour does here.
Step 7. Apply it to your chart
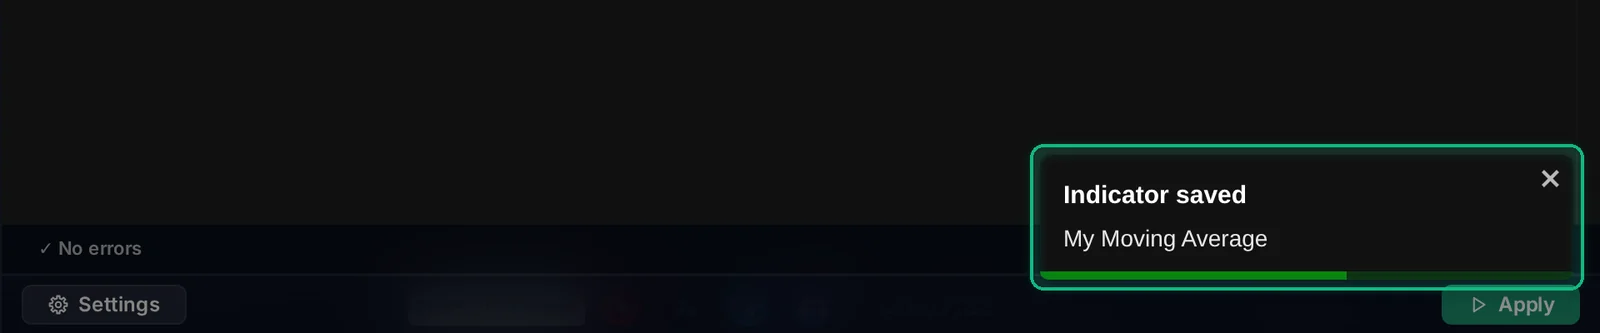
Click Apply (or press Ctrl+S / Ctrl+Enter). Apply saves your indicator and puts it on the chart in one step.
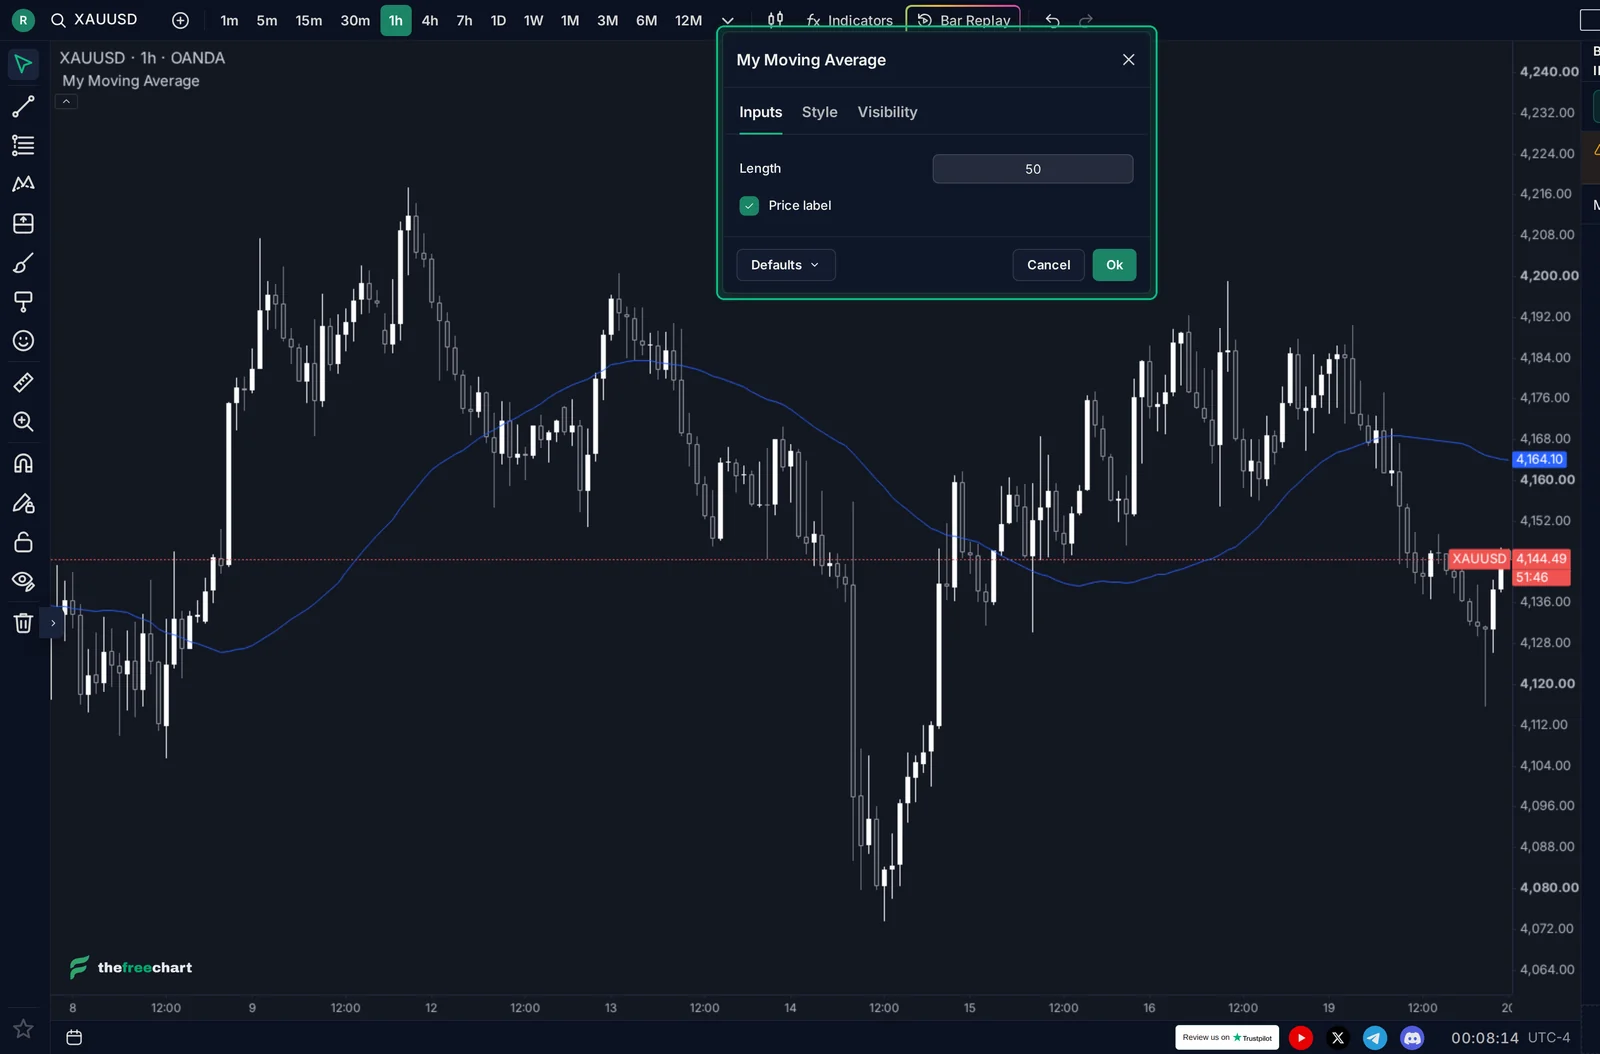
Your moving average now runs on real prices:
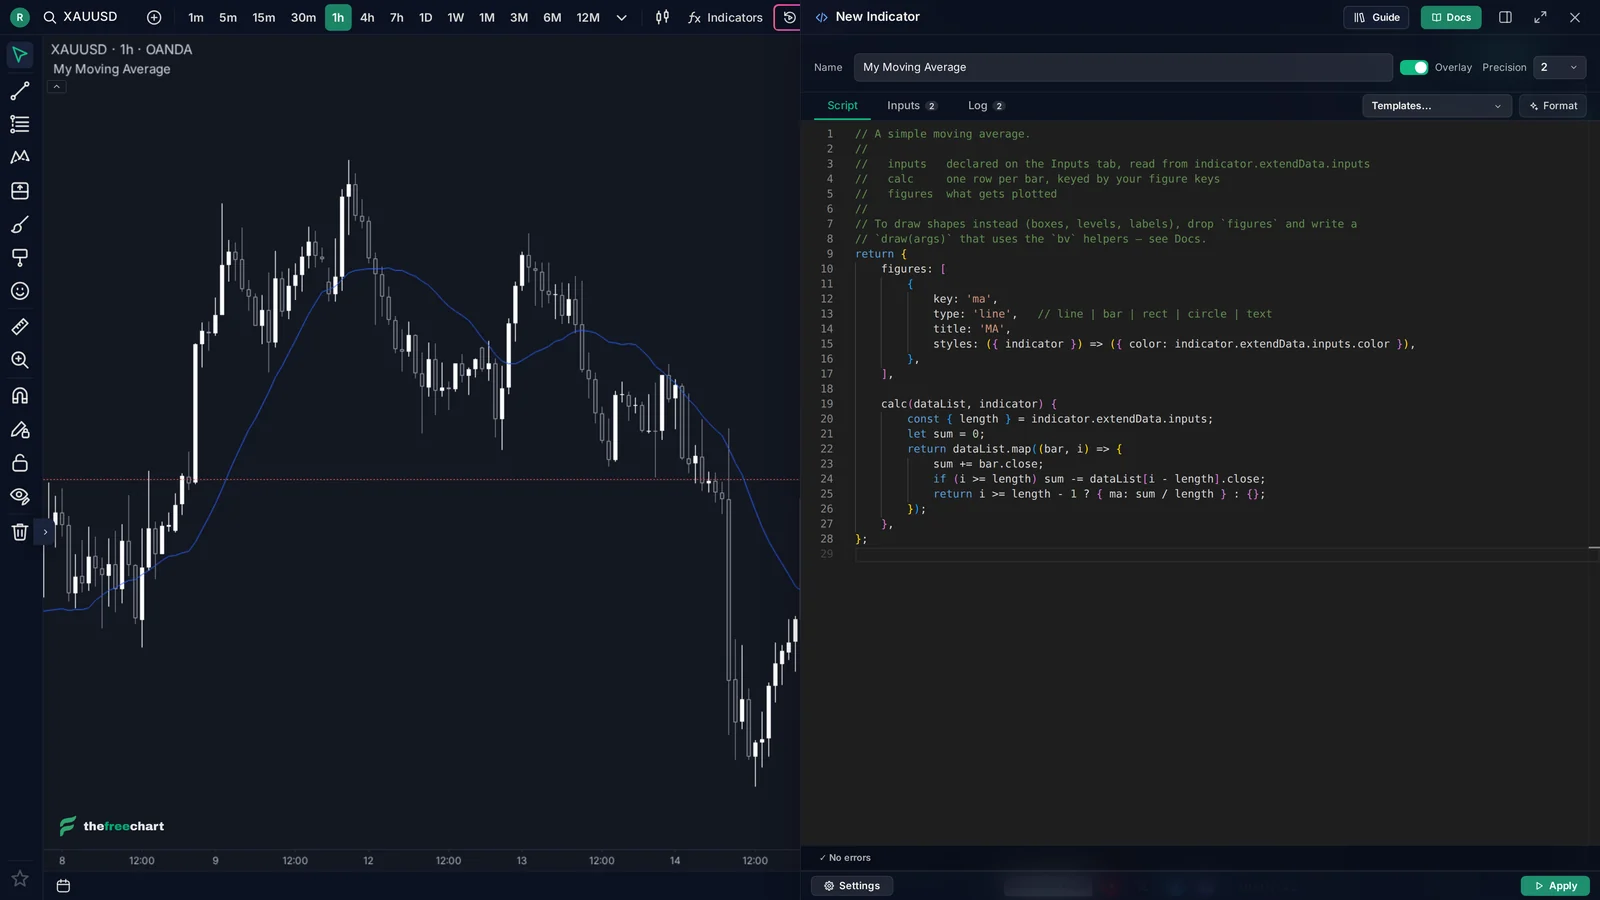
Changed something? Click Apply again. The chart swaps in the new version straight away.
Step 8. Fix errors
The editor checks your code as you type. If something is wrong, the strip at the bottom turns into ✕ Problem with the line and column, the line is underlined in red, and Apply is disabled until it's fixed.
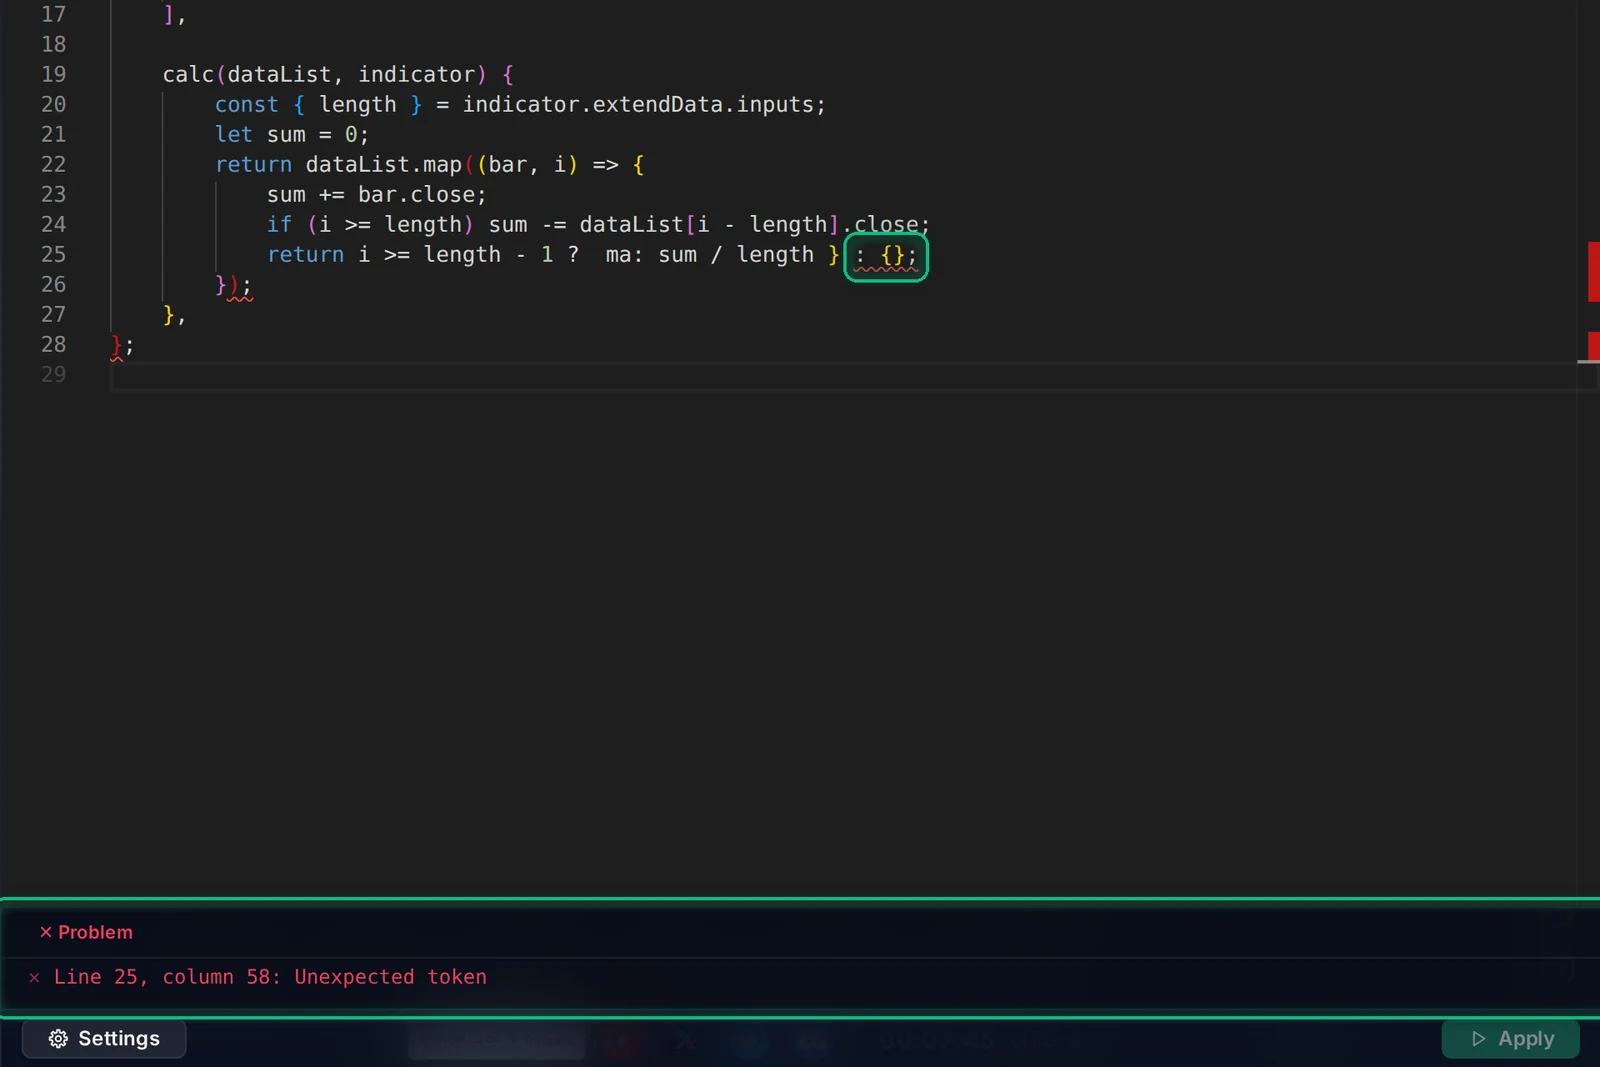
Errors that only happen while the indicator runs on the chart show up in the same strip, with their line when it can be found.
Step 9. Debug with the Log tab
Put console.log(...) anywhere in your script and the output appears in the Log tab while the indicator runs, together with runtime errors. You don't need the browser's developer tools (and they aren't allowed on this site).
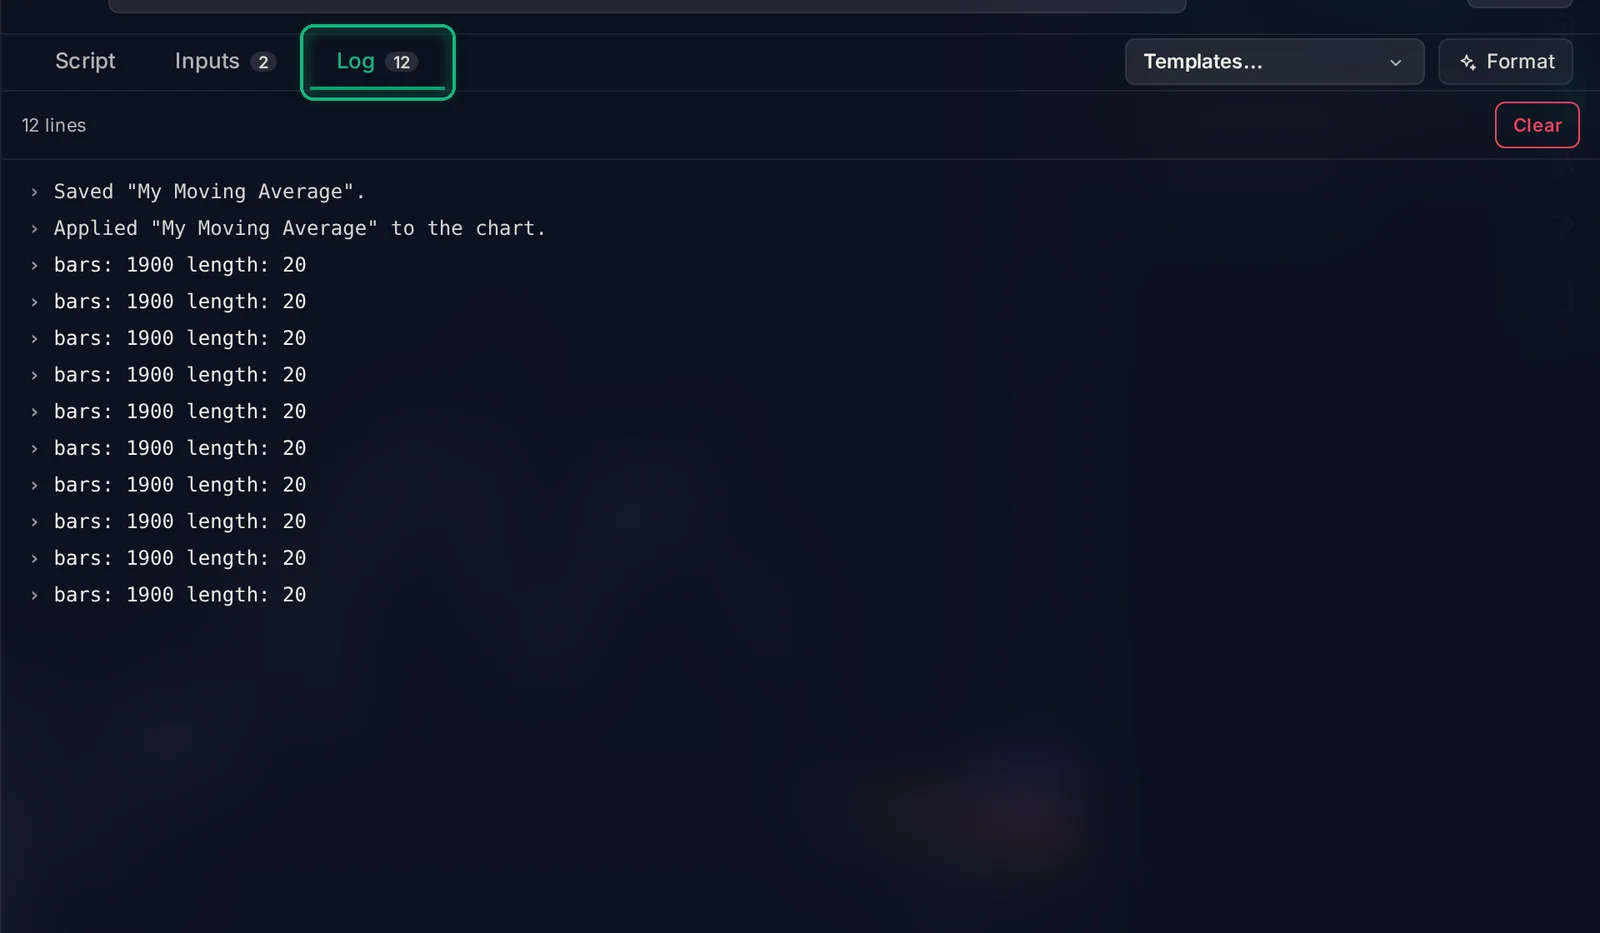
calc runs again whenever the chart gets new data, so a log inside it repeats. Click Clear to start fresh, and remove your logs when you're done.
Step 10. Use it like any other indicator
Your indicator is now in your Build Indicators list. Click it to open it in the editor again.
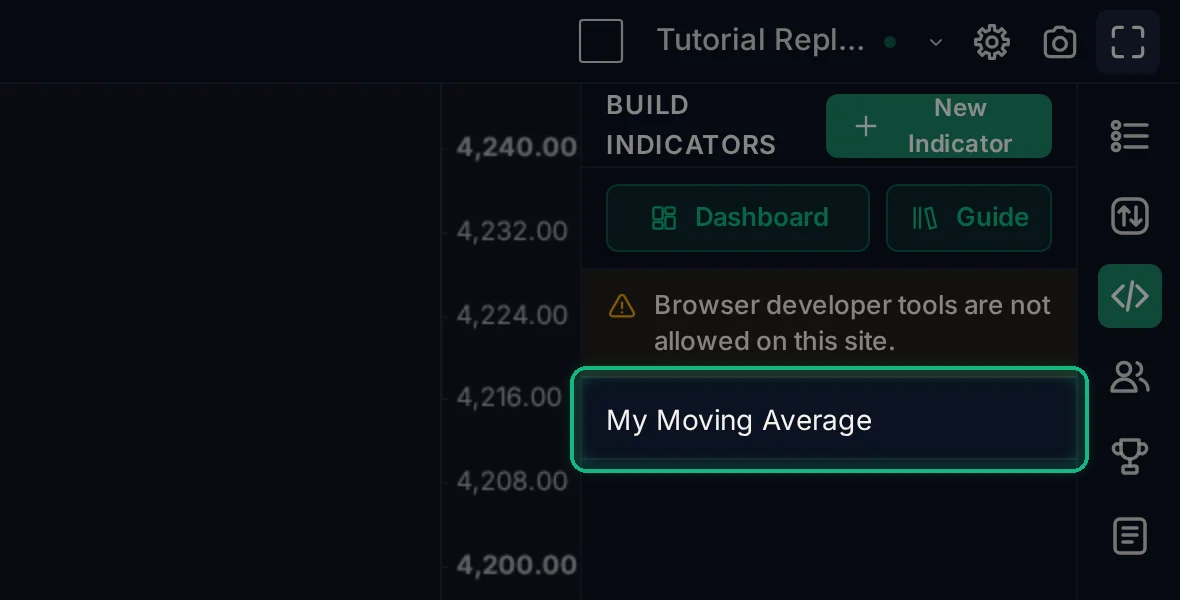
On the chart it behaves like a built-in one: hover its name in the legend for settings, hide and remove. The settings window is built from your inputs, so anyone using it can change the length without reading code.
You can also find it in the Indicators panel under My Scripts, to add it to other charts.
Step 11. Publish it from the Developer Dashboard
Click the gear next to your indicator (or Dashboard at the top of the panel).
First, on the Description tab, write what buyers read and add up to 5 screenshots.
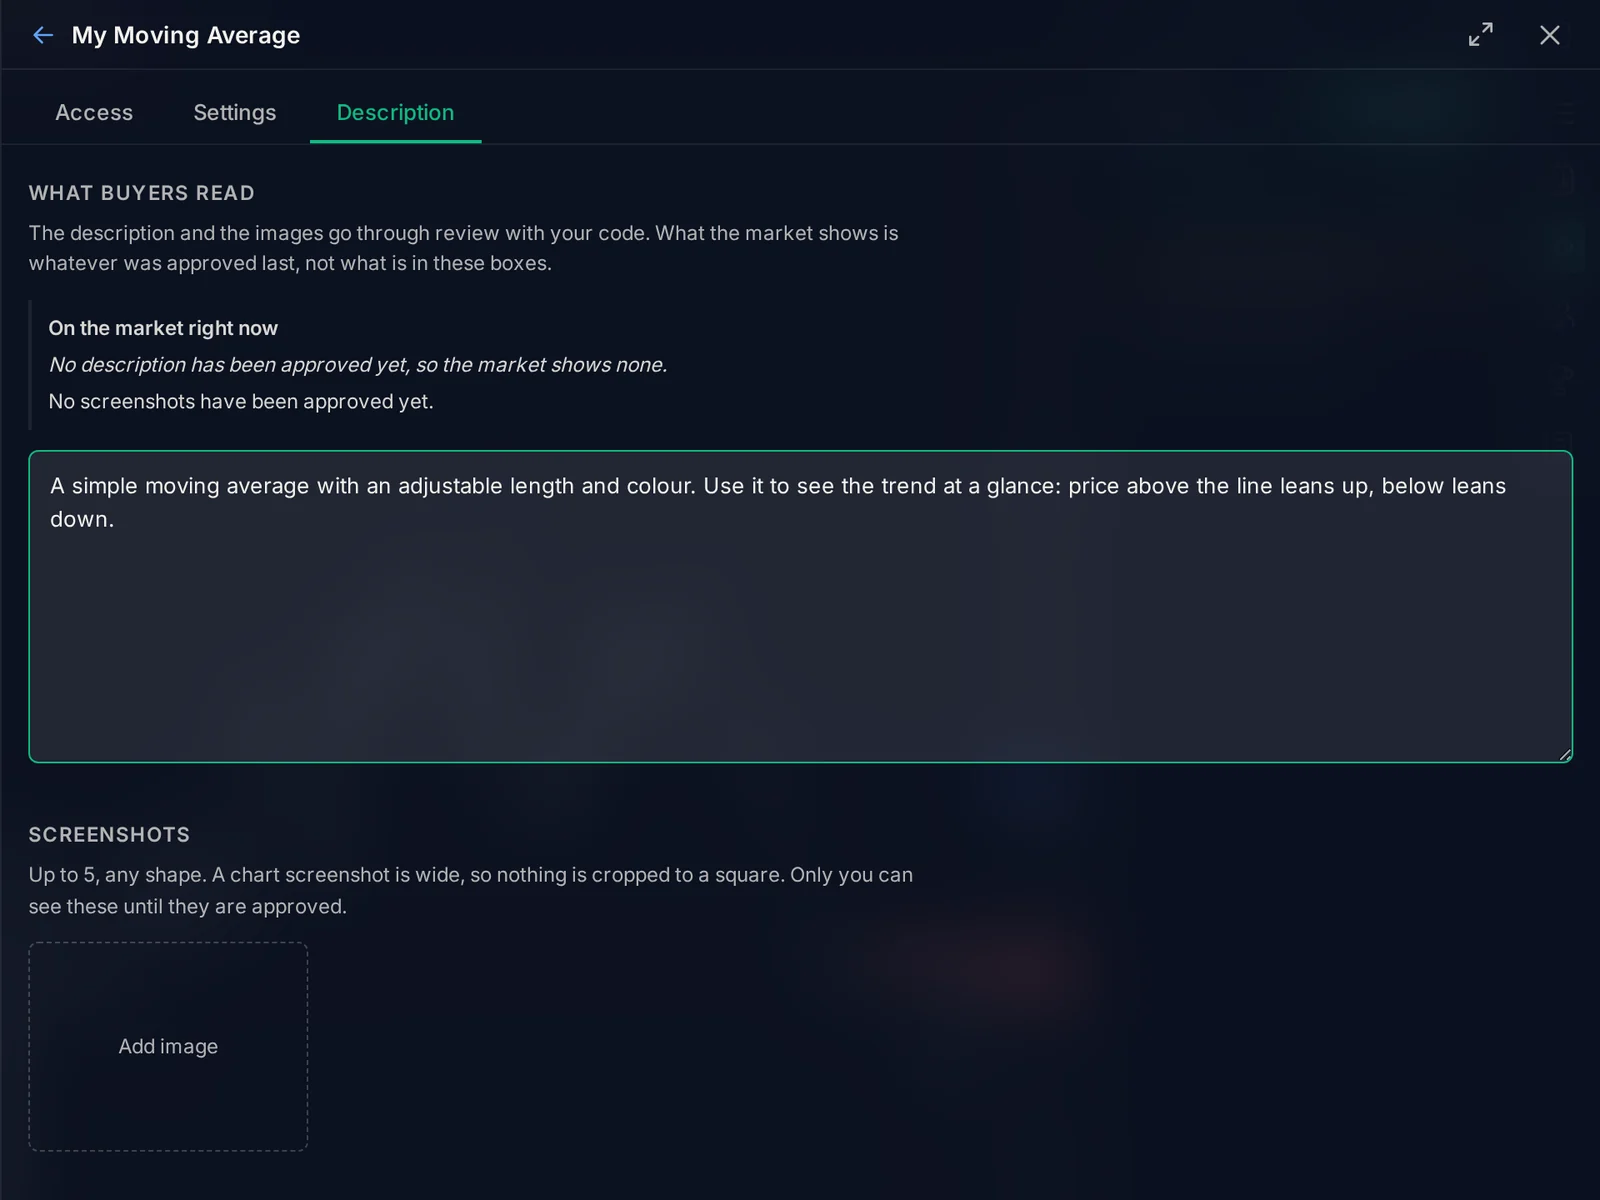
When it's ready, click Make public. It saves your changes and sends the indicator for review: an admin checks the code, the description and the screenshots before anyone else can see it. Until then, only you can use it.

The Settings tab decides who gets it and what it costs:
- Who can add it: everyone, or only people you add.
- Show it in the indicator list: whether it appears in the Marketplace.
- Open source code: whether others can read your script.
- What it costs: free, a one-time payment, or a monthly subscription, with an optional free trial in hours. You keep 70% of each sale.
- Who can use it: give it to someone by email, with or without an expiry date, or invite them to buy it.
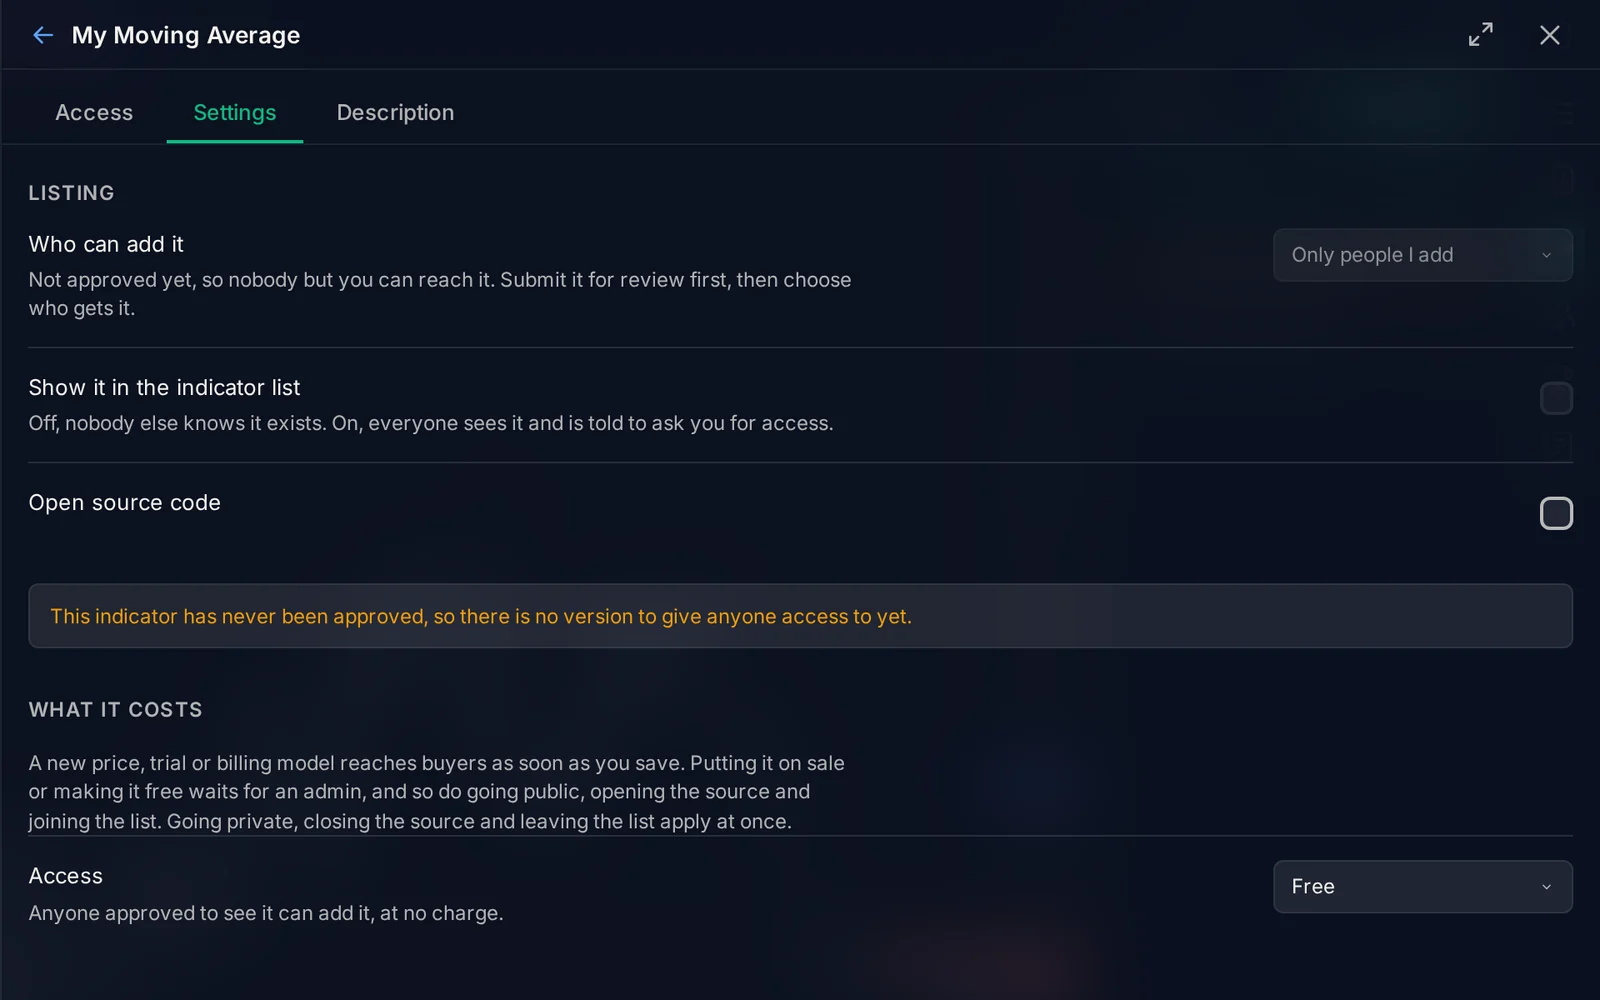
Who can add it and who can use it unlock once the indicator is approved, because until then there is no approved version to give anyone. A new price or trial applies as soon as you save. Putting it on sale, making it free, going public or opening the source waits for review. Later changes to the code go through review too, and users keep the approved version until the new one is approved.
The Access tab shows who has your indicators, and Earnings shows your sales and payouts.
Quick tips
- Keep the Docs open in a second tab while you write. The answer to "how do I draw this?" is almost always there.
- Start from a template close to what you want, then change it a little at a time, clicking Apply after each change.
- Turn magic numbers into inputs. If you might ever want to change a value, put it on the Inputs tab.
- Test it in Replay. Run your indicator over past data in the Trading Simulator before you trust it.
- Pick a unique name before publishing. The review refuses a name another published indicator already uses, or the name of a built-in indicator.
New to indicators? Start with How to Use Indicators. Ready to code? Open a chart and click </>.
No comments yet. Login to start a new discussion Start a new discussion