How to Use Indicators: Add, Configure and Manage Them
Indicators turn raw price into something you can read at a glance: a trend, momentum, volatility. On The Free Chart you can add built-in indicators like moving averages, RSI and Bollinger Bands, ad
Indicators turn raw price into something you can read at a glance: a trend, momentum, volatility. On The Free Chart you can add built-in indicators like moving averages, RSI and Bollinger Bands, add indicators written by other traders from the Marketplace, ask the community for one that doesn't exist yet, or build your own.
This guide covers everything you need to put indicators on a chart and make them look and behave the way you want.
Step 1. Open the Indicators panel
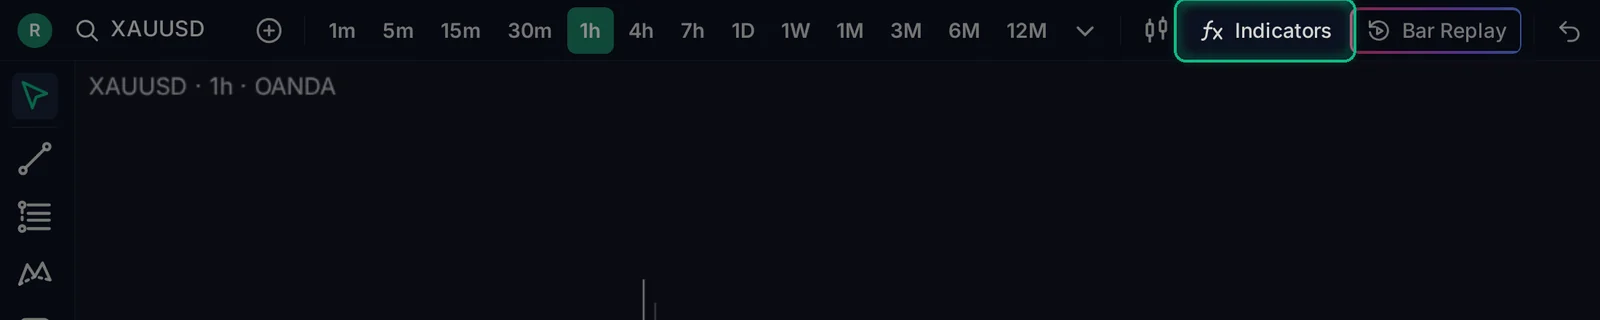
Click Indicators in the top toolbar. You can also press / on your keyboard.
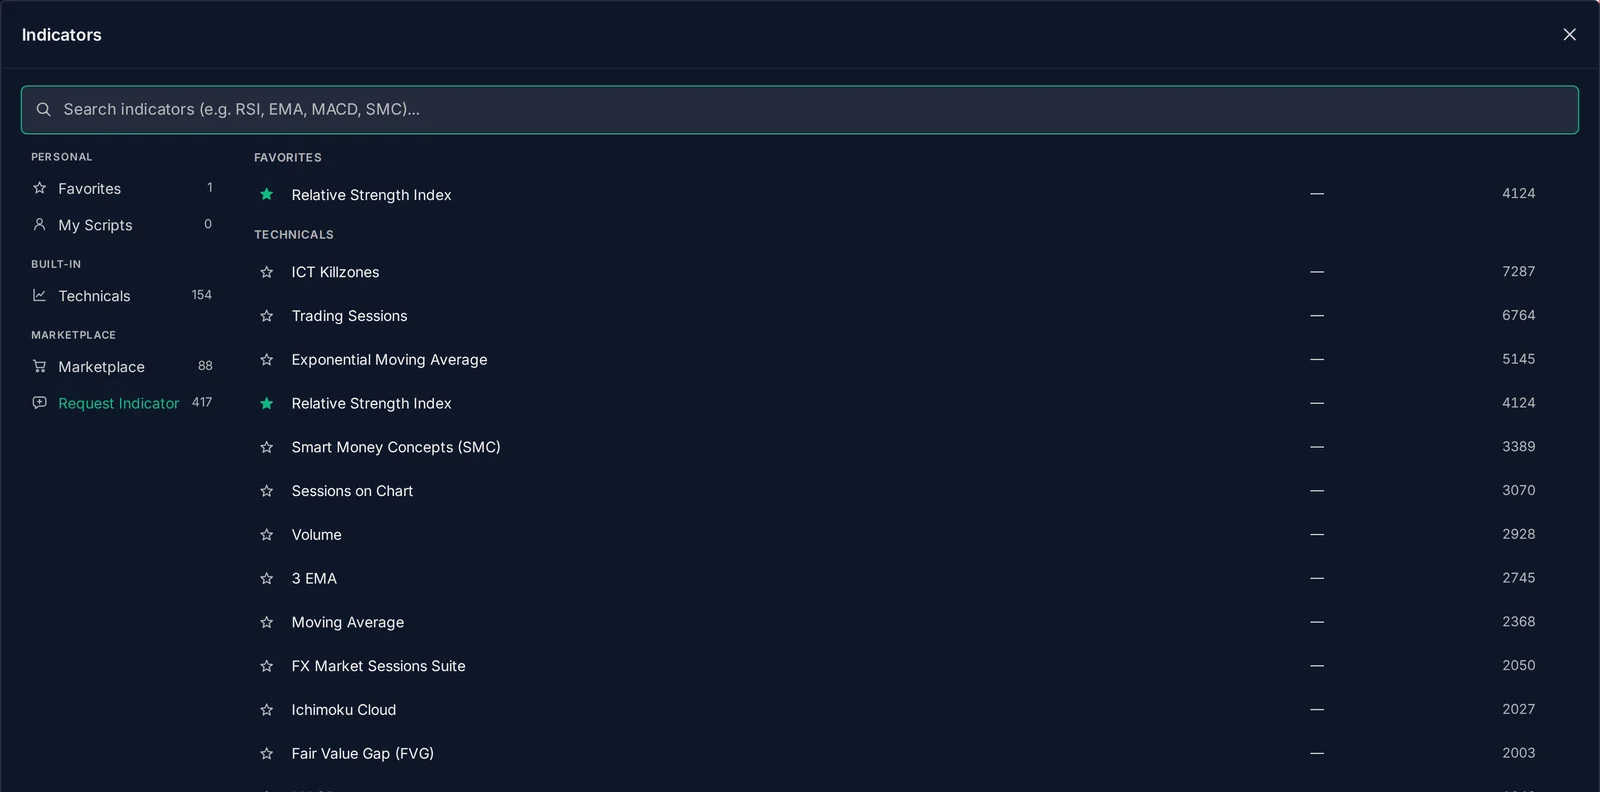
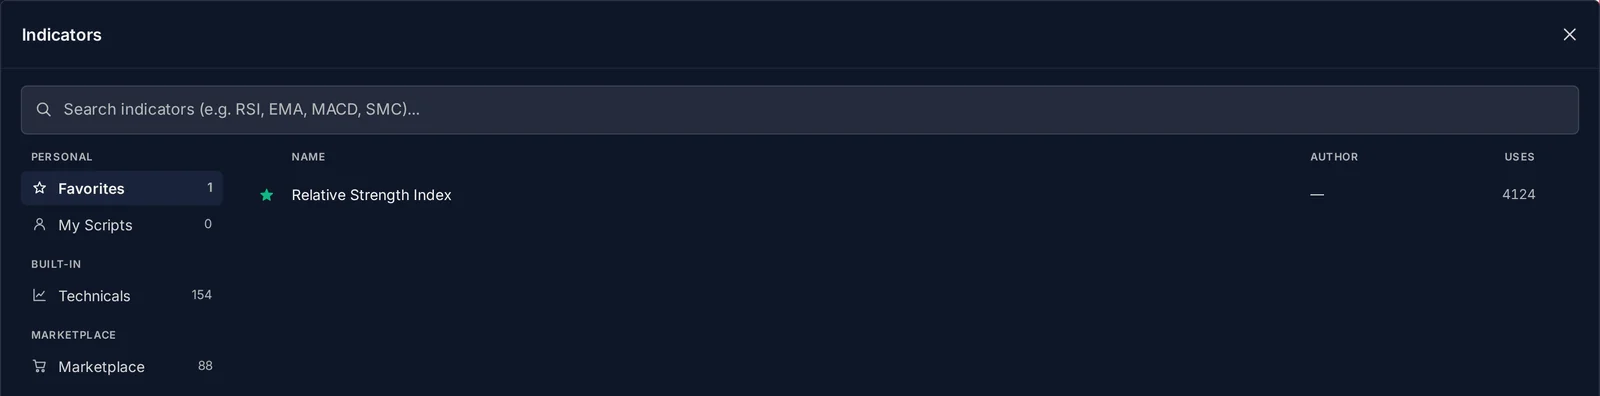
The panel lists every indicator, grouped on the left:
- Personal: your Favorites and My Scripts (indicators you built yourself).
- Built-in: Technicals, the classic indicators.
- Marketplace: indicators published by other traders, and Request Indicator.
Step 2. Find and add an indicator
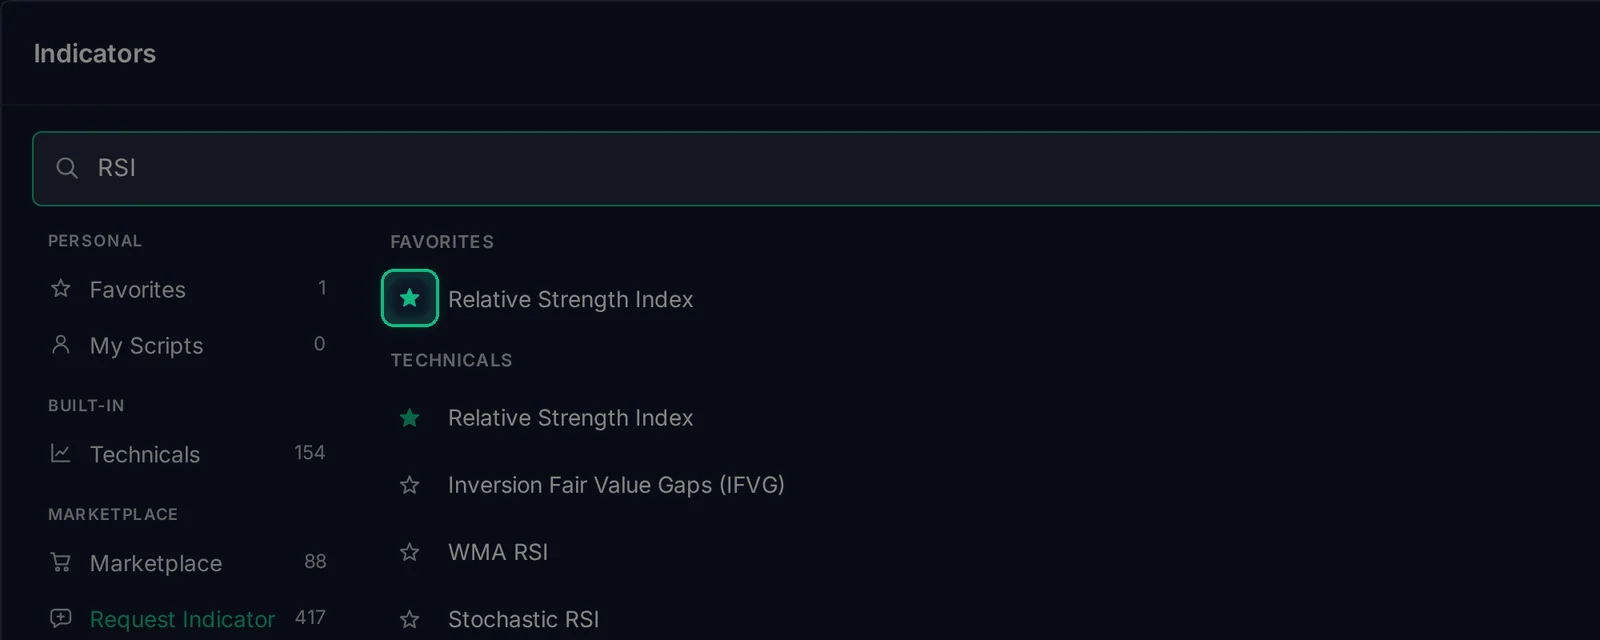
Type in the search box. It matches any part of the name, and initials too: "bb" finds Bollinger Bands. Results come from every group, built-in and Marketplace.
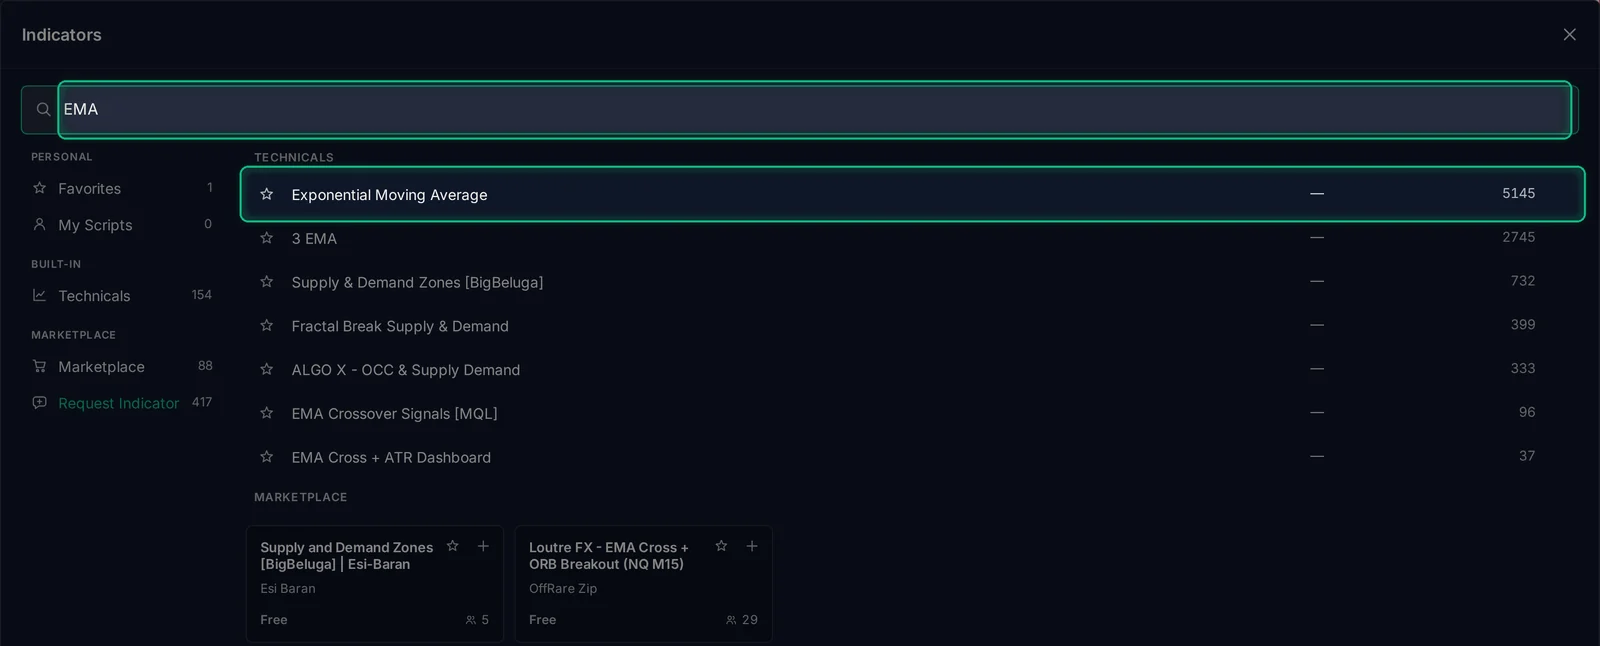
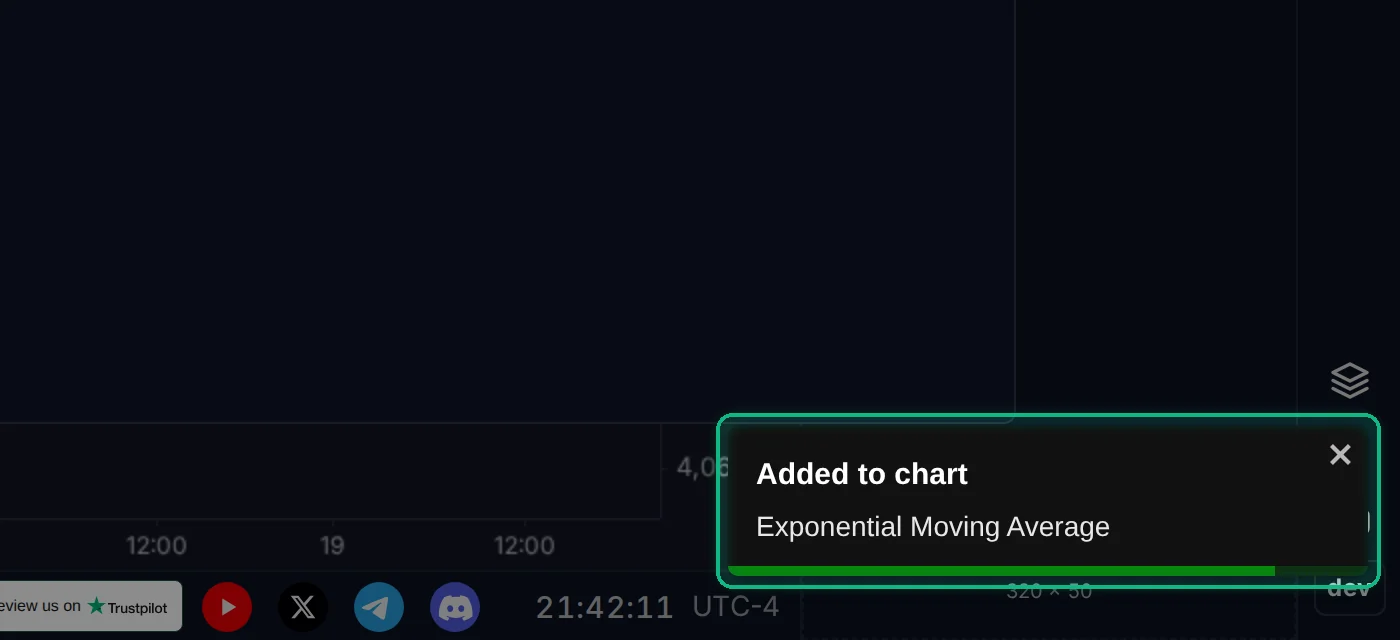
Click a result to add it to the chart, or press Enter to add the first one. A short message confirms it.
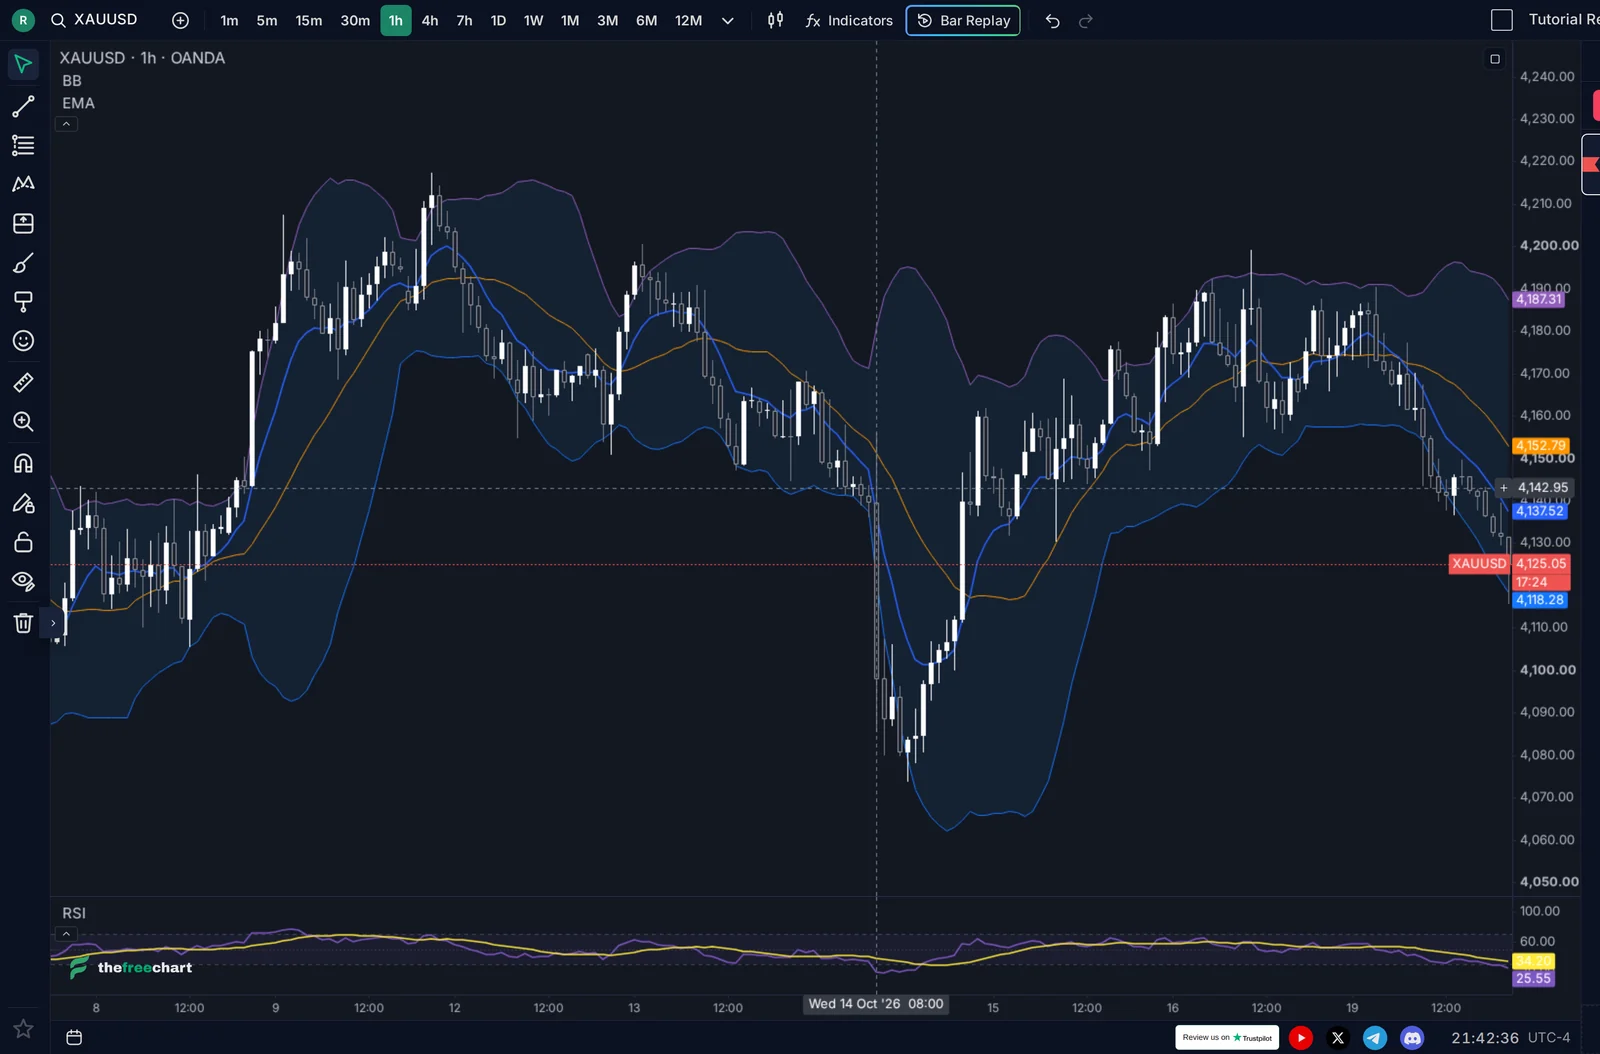
The panel stays open after each add, so you can add several indicators in a row. In this example: Exponential Moving Average, Relative Strength Index and Bollinger Bands.
A greyed-out result can't be added. Its label says why: for example, a Marketplace indicator you haven't got access to yet, or an indicator that needs volume data on a symbol whose feed has none.
Step 3. Keep your favorites one click away
Click the ☆ next to any indicator to add it to Favorites. Next time, open Favorites in the sidebar instead of searching. When you're signed in, favorites follow you to every device.
Close the panel when you're done. The indicators are on your chart: overlays such as EMA and Bollinger Bands draw on the price, and oscillators such as RSI get their own pane underneath.
Step 4. Control an indicator from its legend
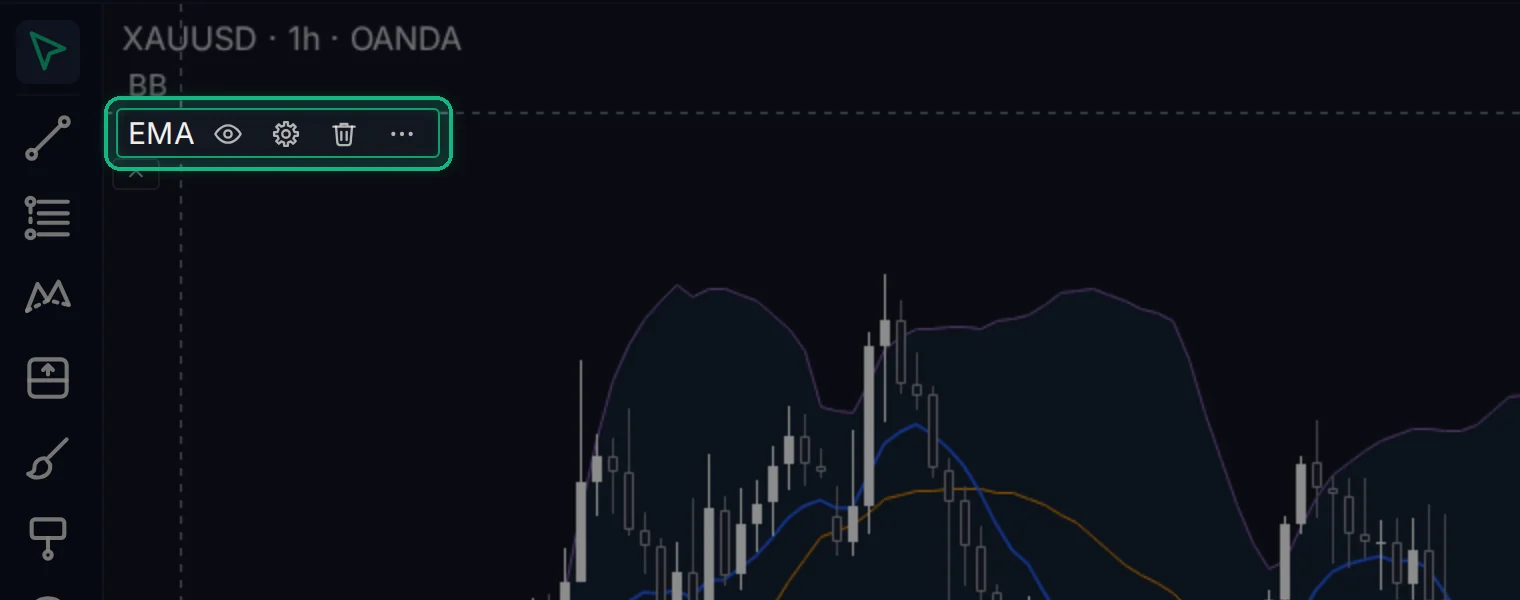
Each indicator's name is listed in the top-left corner of its pane. Hover over the name (on a phone: tap it) and its buttons appear:
- Eye: hide or show the indicator.
- Gear: open its settings.
- Trash: remove it.
- •••: more options.
Step 5. Change the settings
Click the gear to open the settings. There are up to three tabs:
- Inputs: the calculation, for example the length and the source price.
- Style: colors, line thickness and style, and decimal precision.
- Visibility: which timeframes show the indicator.
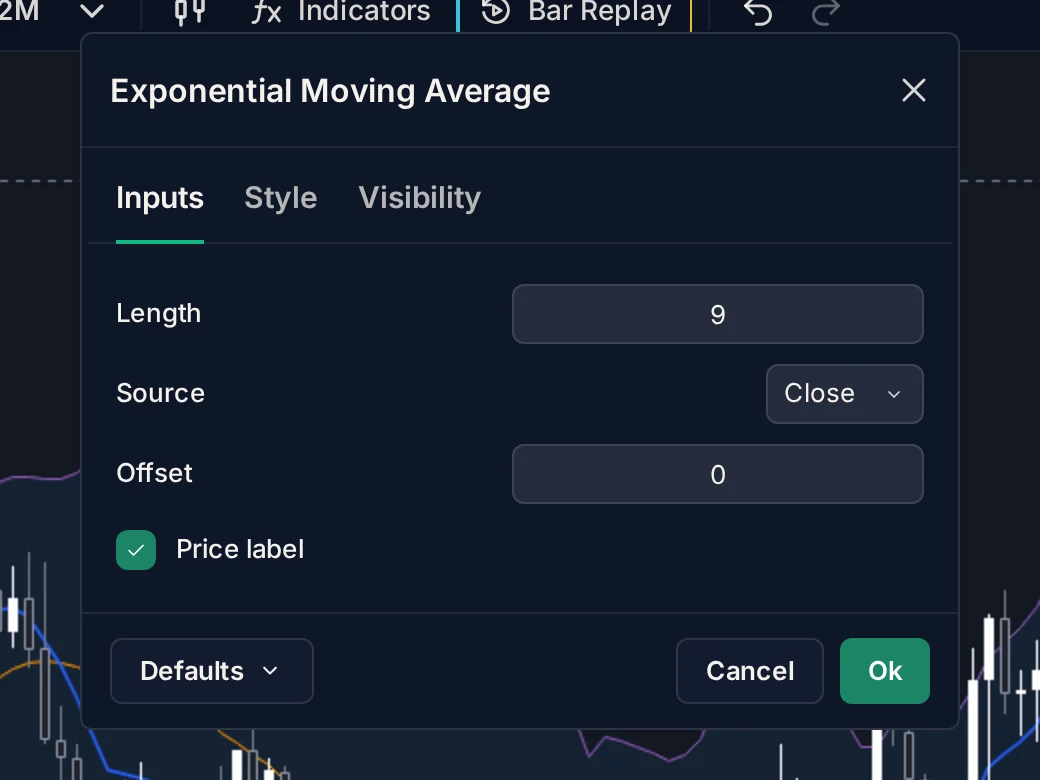
Changes show on the chart while you edit, so you can see the effect before you commit. Here the EMA length goes from 9 to 50, and the line on the chart becomes smoother right away.
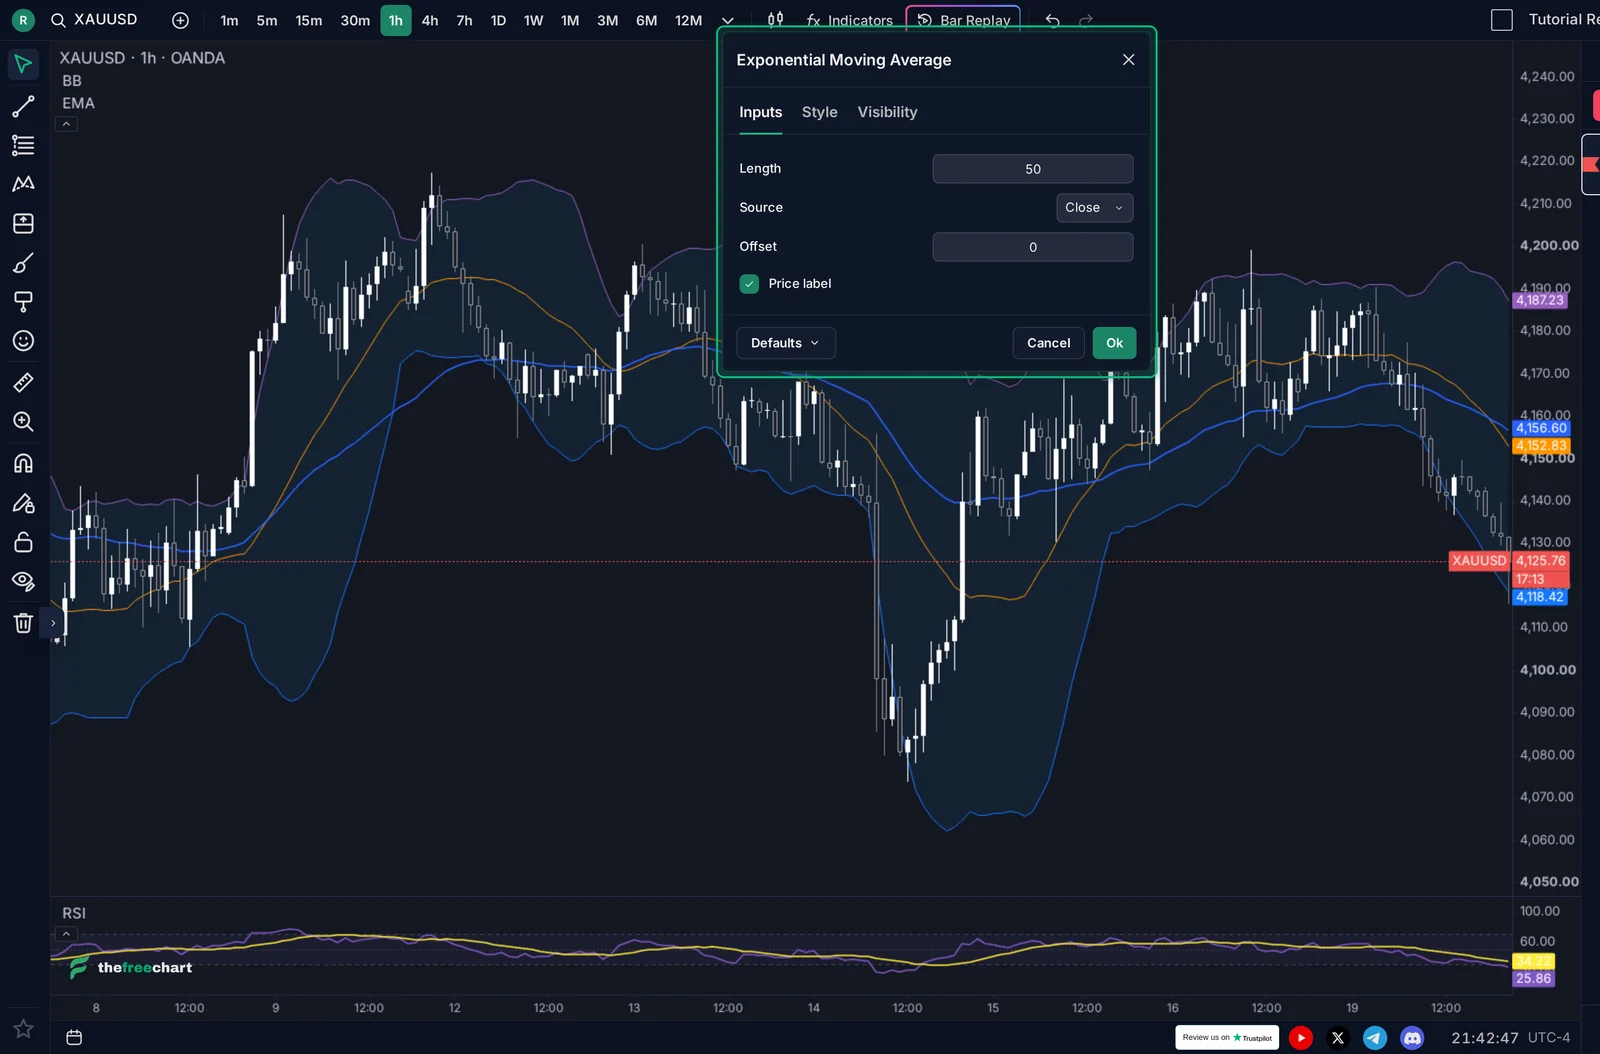
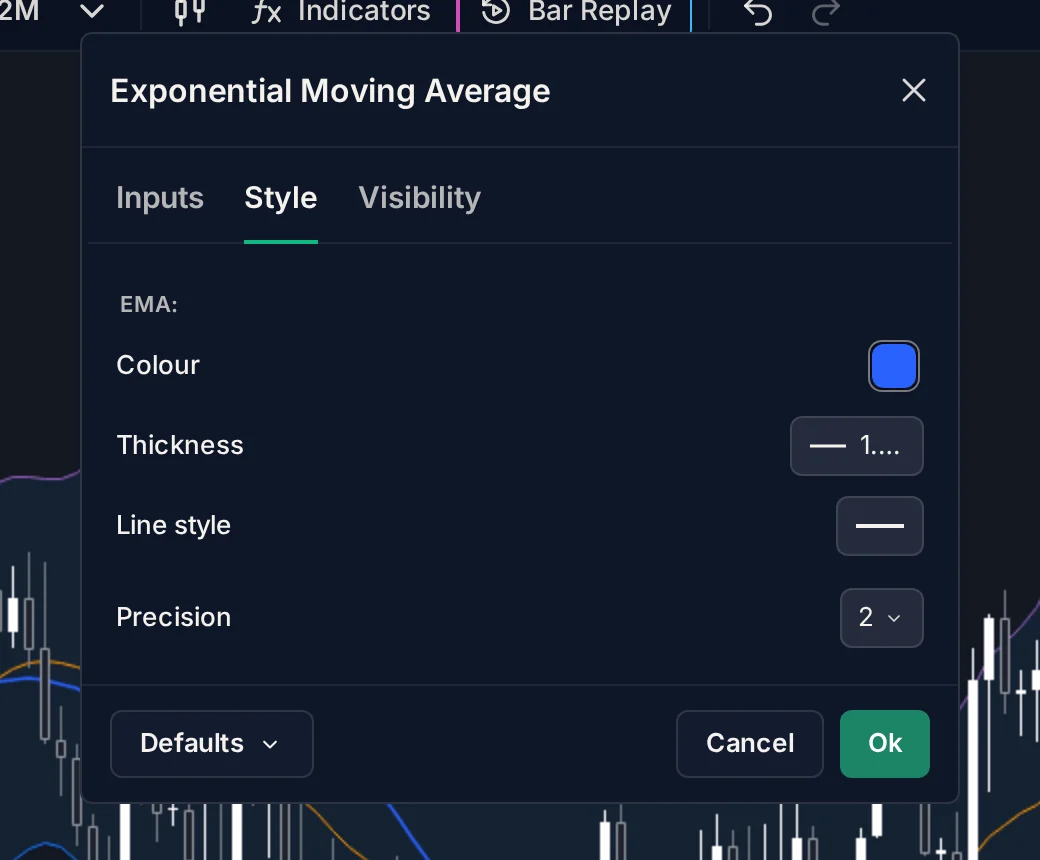
Click Ok to keep the changes or Cancel to go back to how it was. Defaults saves your settings as a template, or restores the original ones.
Step 6. More options: panes, order and scale
The ••• button opens the rest:
- Visual order: bring an indicator in front of others, or send it behind.
- Move to: move it to a new pane above or below, or into an existing pane. Useful to put two oscillators together, or to give an overlay its own space.
- Pin to scale: choose which price scale, left or right, the indicator follows.
- Hide, Remove Indicator and Settings.
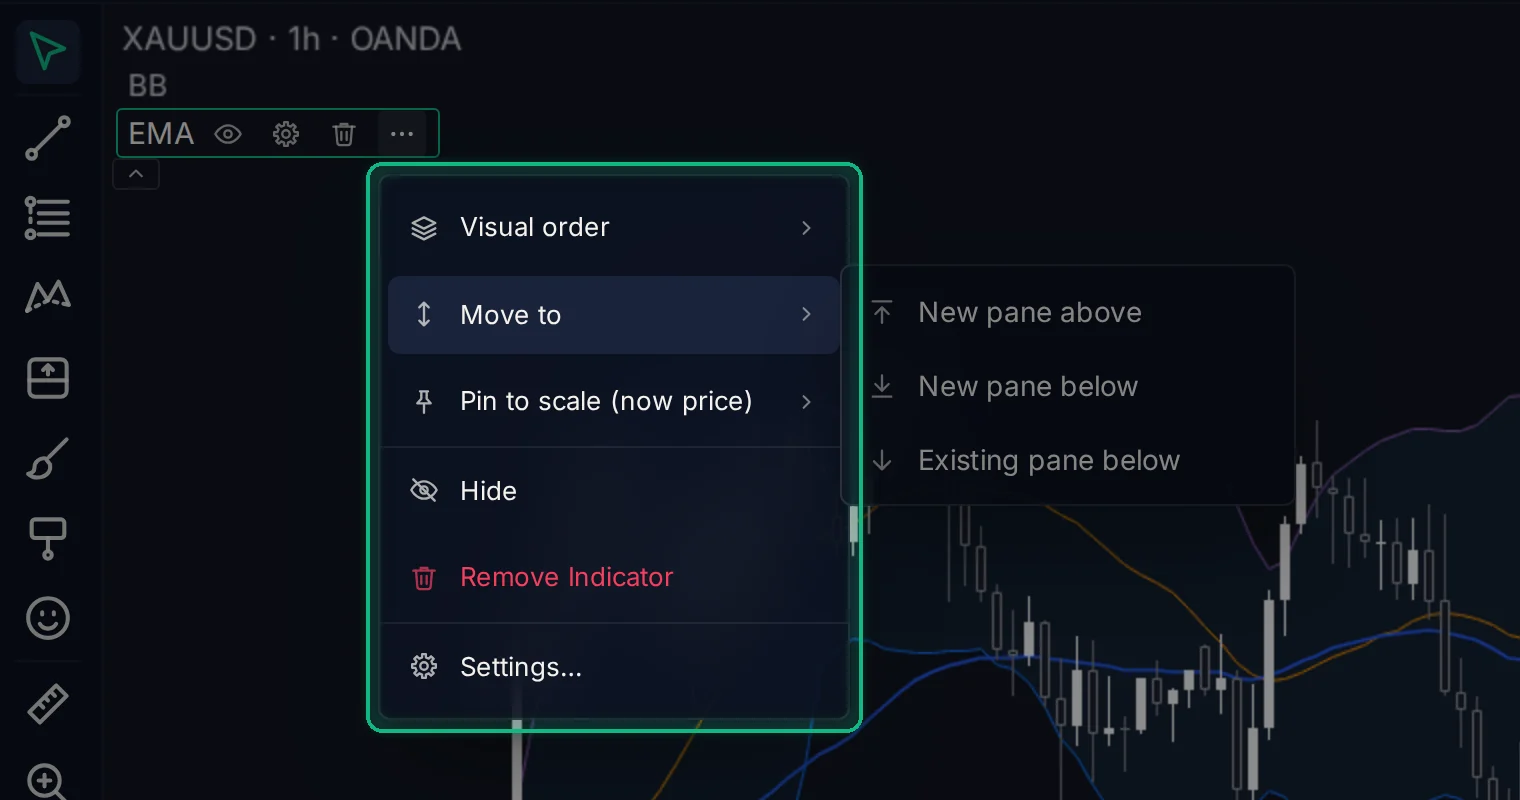
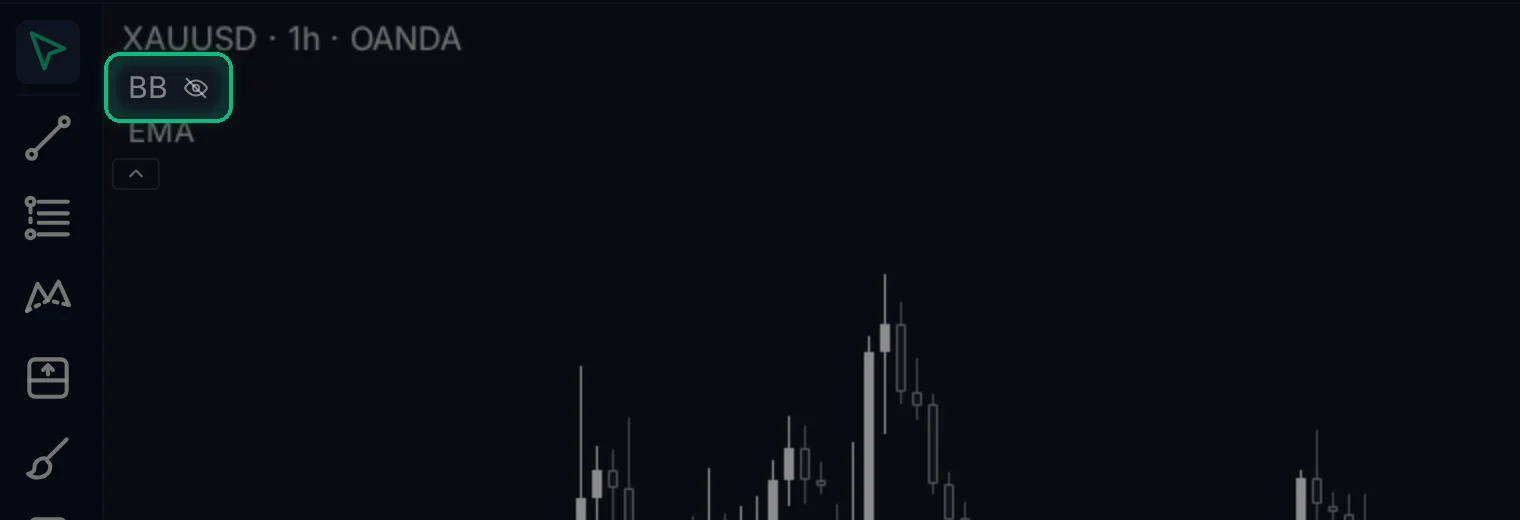
A hidden indicator stays in the legend, crossed out with an eye icon. Click it to show the indicator again. Hiding is handy to compare a chart with and without an indicator, without losing its settings.
Step 7. Browse the Marketplace
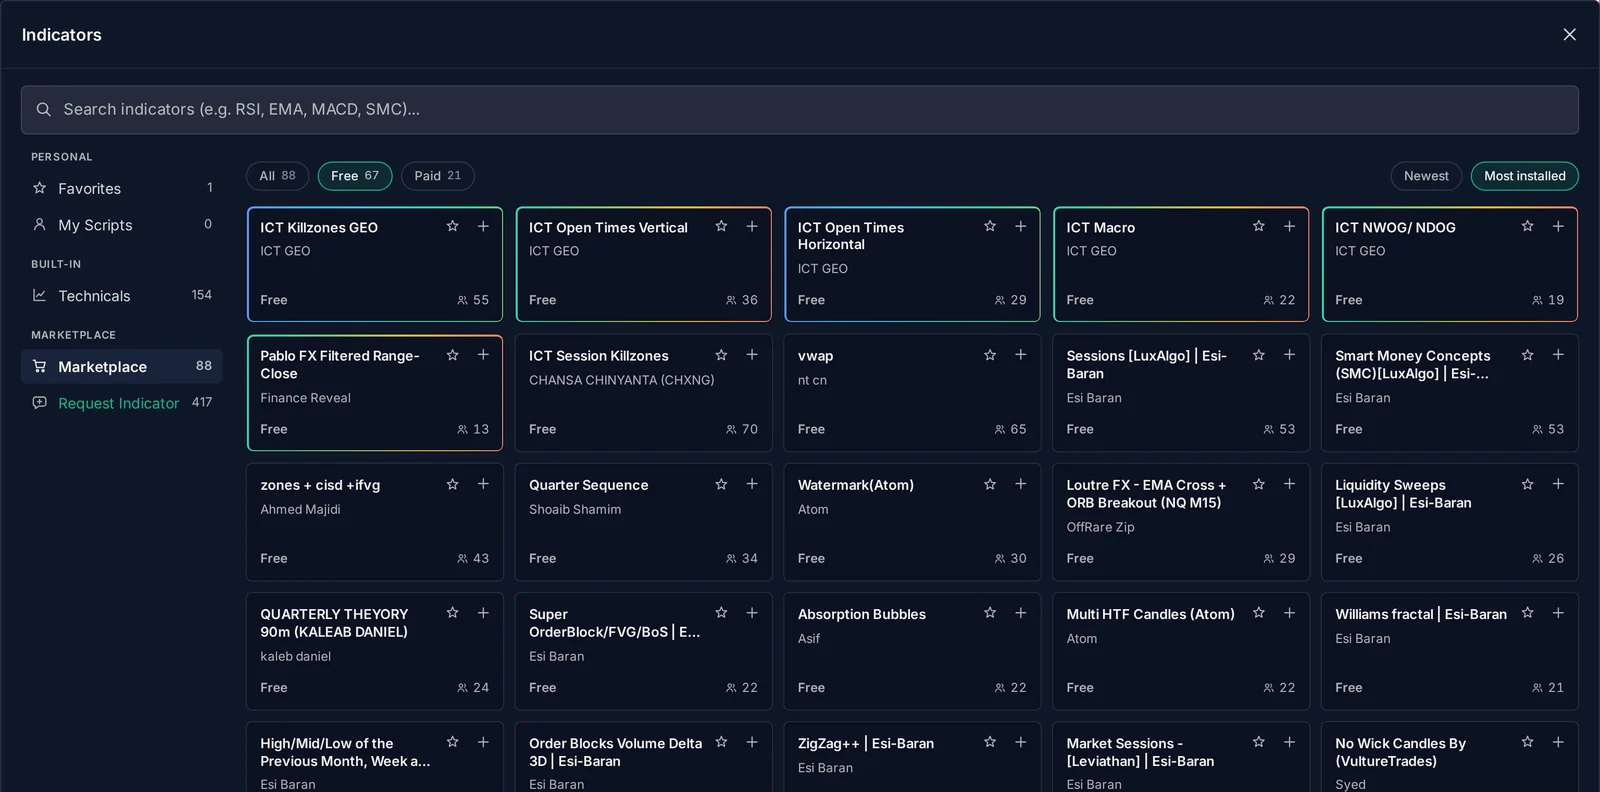
Open Marketplace in the panel to see indicators published by other traders. Filter by All, Free or Paid, and sort by Newest or Most installed. Each card shows the author and how many traders use it.
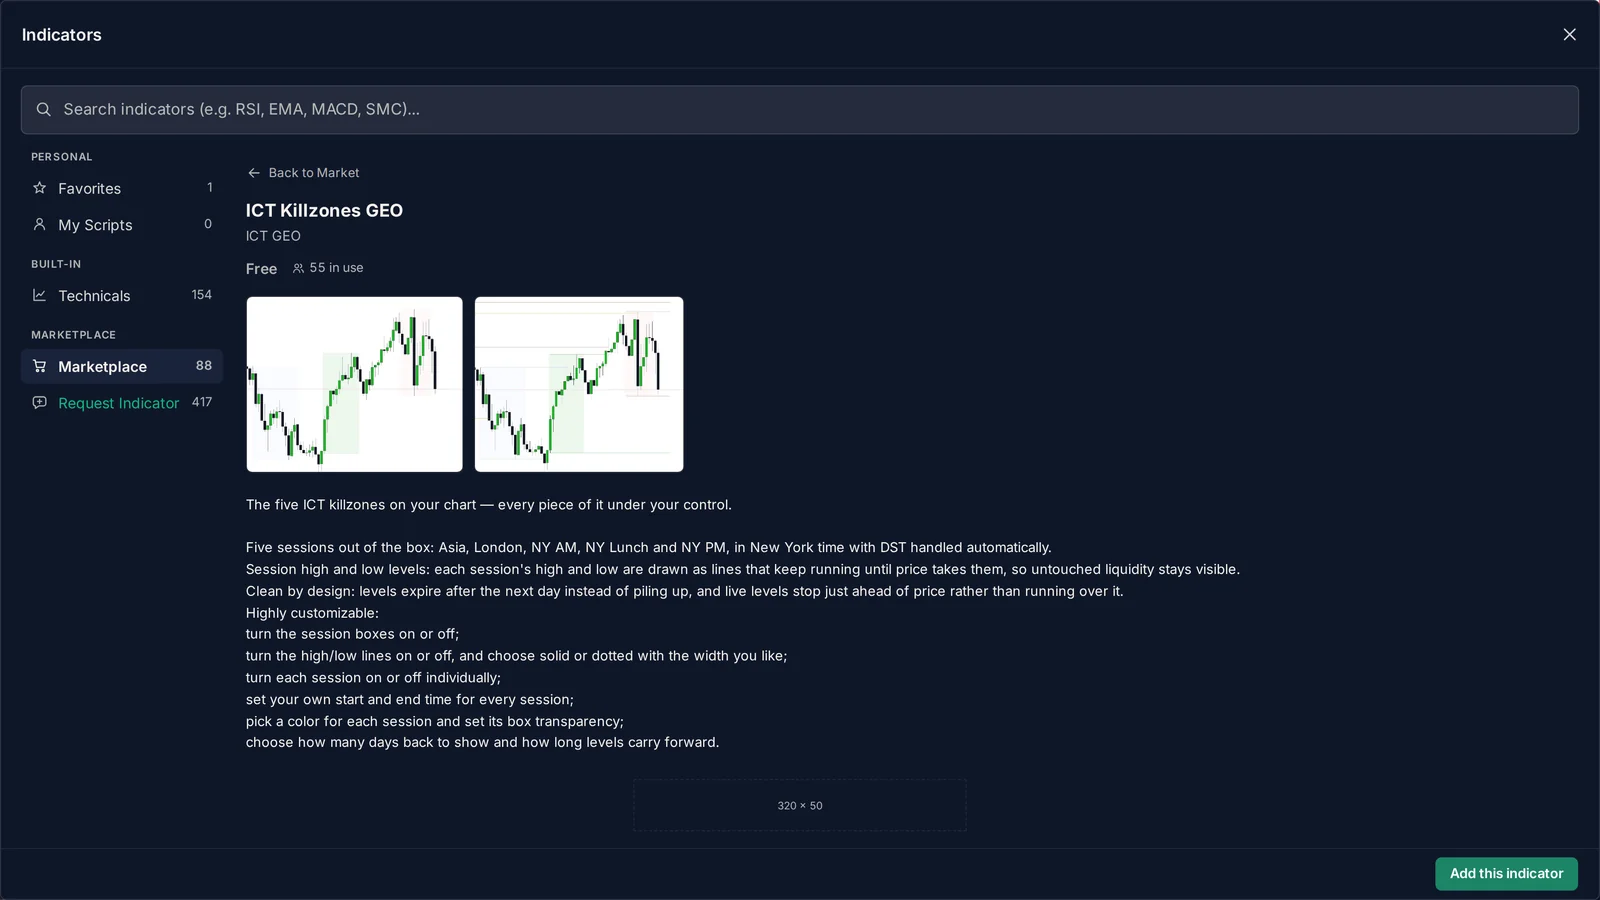
Click a card to read what the indicator does, then click Add this indicator. Paid indicators show their price instead, with a Buy indicator button and, when the author offers it, a free trial. You need to be signed in to add Marketplace indicators.
Step 8. Request an indicator
Can't find the one you need? Open Request Indicator. You can see what others have asked for and vote for the requests you want too (the arrow on the right). Click New request to add yours: a title, a link to a reference (for example a TradingView script), the original code if you have it, and notes.
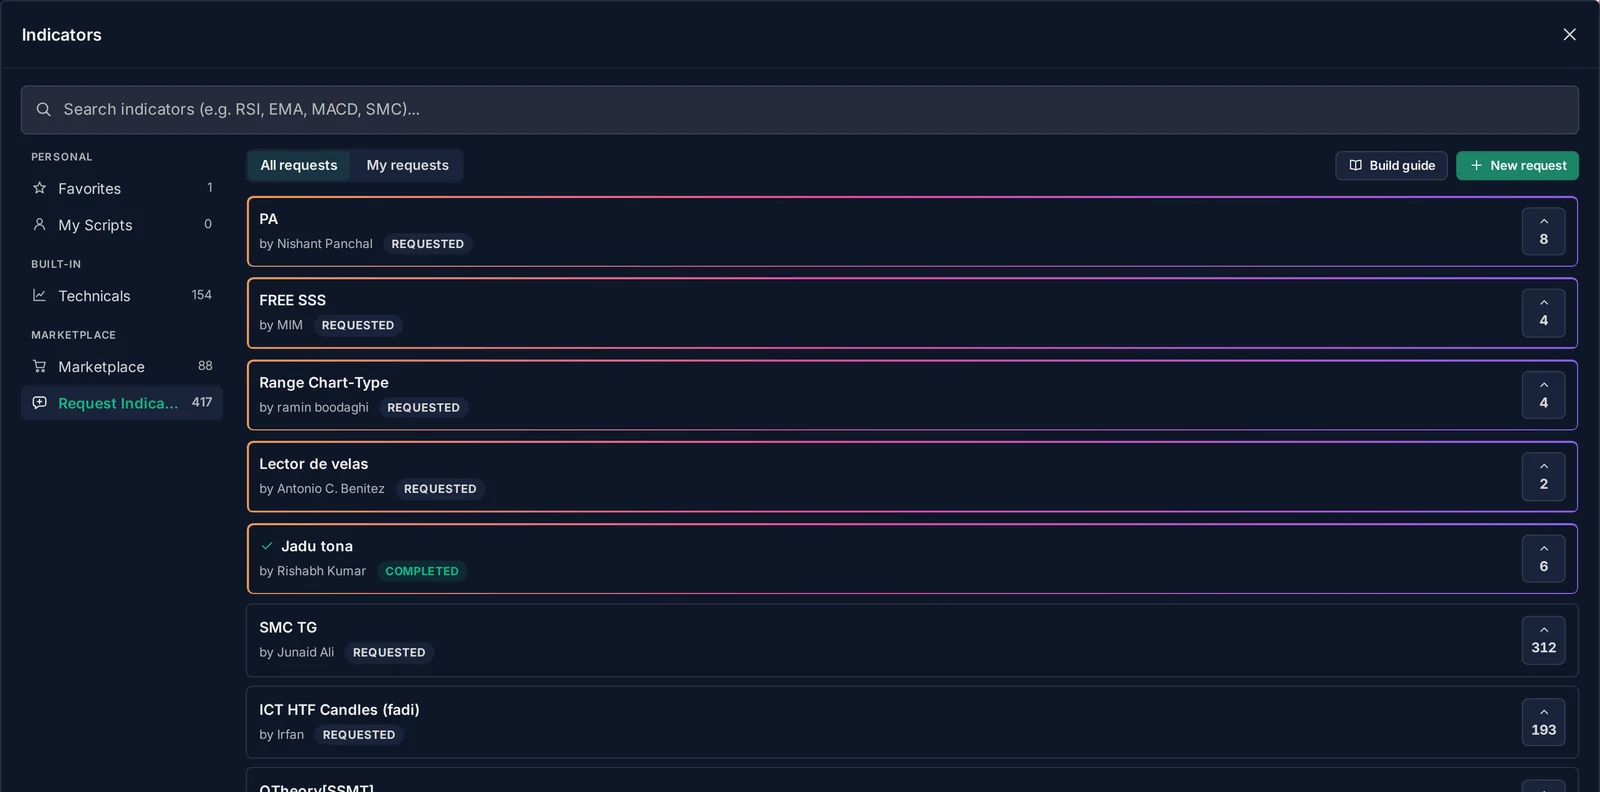
Votes show which requests matter most to traders. When a request is built, it is marked Completed.
Step 9. Build your own
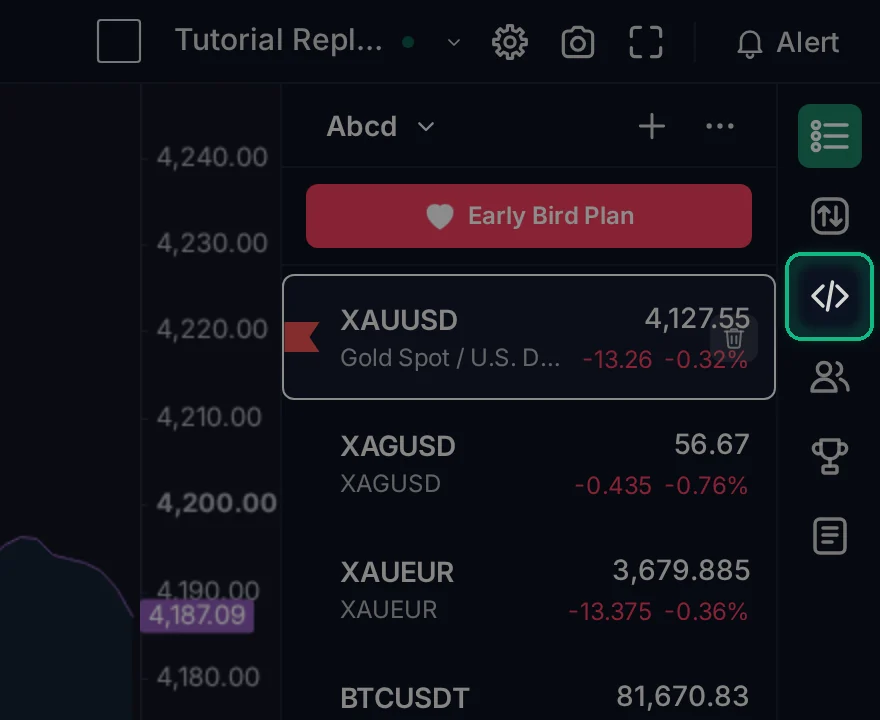
If you code, you can write your own indicators. Click the Build Indicators icon (</>) in the right-hand toolbar to open the editor, write your script, and click Apply to put it on your chart. You can keep it private, or publish it to the Marketplace for free or for a price. The full walkthrough is in How to Build Your Own Indicator.
Quick tips
- Less is more. Two or three indicators you understand beat ten you don't. Too many lines hide the price.
- Pair different kinds. A trend indicator (moving average) plus a momentum indicator (RSI) tells you more than two moving averages.
- Hide instead of removing when you want to compare. Your settings stay.
- Test them in Replay. Before trusting an indicator with real money, practice with it on past data in the Trading Simulator.
The Free Chart is free. Open a chart and press / to add your first indicator.
No comments yet. Login to start a new discussion Start a new discussion